Category: Articles

  • Kiki vs. Bouba: A Psychological Phenomenon

    Kiki vs. Bouba: A Psychological Phenomenon


    Begin by taking this fun quiz! –> Are These More “Bouba” Or “Kiki”? (buzzfeed.com)

    Were you among the majority that named the spiky figure Kiki and the round figure Bouba? It seems that this is the case for many individuals. This question of “Kiki or Bouba” emerged with the famous psychological experiment conducted by neuroscientist V. S. Ramachandran and Edward Hubbard (Ramachandran and Hubbard, 2001). They asked American and Tamil Speakers to match one of the names to each of the two figures. The results were overwhelmingly the same; enough so to have a significant meaning. However, the real question now is, “Why?”

    There are many theories to answer this specific question. The three that rise to the top are the linguistic, semantic, and perceptual hypotheses (Chen et al., 2021). The linguistic point of view theorizes that this is a result of the sensory-motor connections that humans make when learning speech. The semantic approach, on the other hand, highlights that people may have speech associations to certain meanings. Lastly, the perceptual hypothesis looks into the features of sounds, such as varying frequencies, in relation to the connections people make to those shapes. These hypotheses continue being tested in various ways to narrow down the potential cause of this fascinating effect.

    On a similar note, have you ever associated a certain sound with a color or a number with a texture? When reviewing the literature of this phenomenon, a common term that is brought up is synesthesia. This term refers to the phenomenon that occurs when one particular sense is stimulated, but an individual actually experiences another sense (Huang, 2019). For example, hearing music but seeing colors as a result, or associating certain numbers to different colors. The reason this phenomenon is closely associated with the Kiki-Bouba Effect is because some scientists believe that the same underlying cognitive mechanisms take place for both (Ramachandran and Hubbard, 2001).

    However, the Kiki-Bouba Effect is not just relevant to shapes and sounds as many studies have branched out and broadened this topic to other senses in recent years. For example, one study looks at different tastes in association with the Kiki-Bouba shapes (Bremner et al., 2012). Here it was found that taste and shape do not translate in the same way across cultures.

    Although this may be very fun to think about… many people bring up other potential explanations and there are even some who doubt the veracity of the original conclusions found. One example is the debate on the shapes of the words and the actual shapes. This can be seen in the more “pointy” look of the letters used to spell Kiki compared to the more “rounded” letters used to spell Bouba.

    Another concept brings up the idea of the frequency that a shape that looks like that would make if it were to break in relation to the associated Kiki-Bouba names. For example, a more jagged item would have a higher-frequency noise when dropped, which would correlate to the higher frequency emitted by the word “Kiki.” This could be related to the idea of onomatopoeias, which are words that sound like the thing they are describing.

    With all of this in mind, all current research on this phenomenon is in the stage of finding out why this occurs. By answering that question, much could be unlocked. For one, it would reveal a fundamental component of understanding human perception. In knowing this, we could possibly even create robots that can perceive the world like we do!


    Bibliography:

    Abe, K. A. (2015, April 10). Are these more “Bouba” or “kiki”? BuzzFeed. Retrieved from https://www.buzzfeed.com/keijiroabe/are-these-more-bouba-or-kiki-17wkb. 

    Bremner, A. J., Caparos, S., Davidoff, J., de Fockert, J., Linnell, K. J., & Spence, C. (2013). “Bouba” and “kiki” in Namibia? A remote culture make similar shape–sound matches, but different shape–taste matches to Westerners. Cognition, 126(2), 165–172. https://doi.org/10.1016/j.cognition.2012.09.007 

    Chen, Y.-C., Huang, P.-C., & Spence, C. (2021). Global shape perception contributes to crossmodal correspondences. Journal of Experimental Psychology: Human Perception and Performance, 47(3), 357–371. https://doi.org/10.1037/xhp0000811

    Huang, H. (2019, June 28). What’s the neuroscience behind the Bouba/Kiki Effect? NBB in Paris. Retrieved from https://scholarblogs.emory.edu/nbbparis/2019/06/28/whats-the-neuroscience-behind-the-bouba-kiki-effect/

    Ramachandran V, Hubbard E (2001) Synaesthesia—A Window Into Perception, Thought and Language
  • The Green Tree Frog: Southern Summer Ambience

    The Green Tree Frog: Southern Summer Ambience

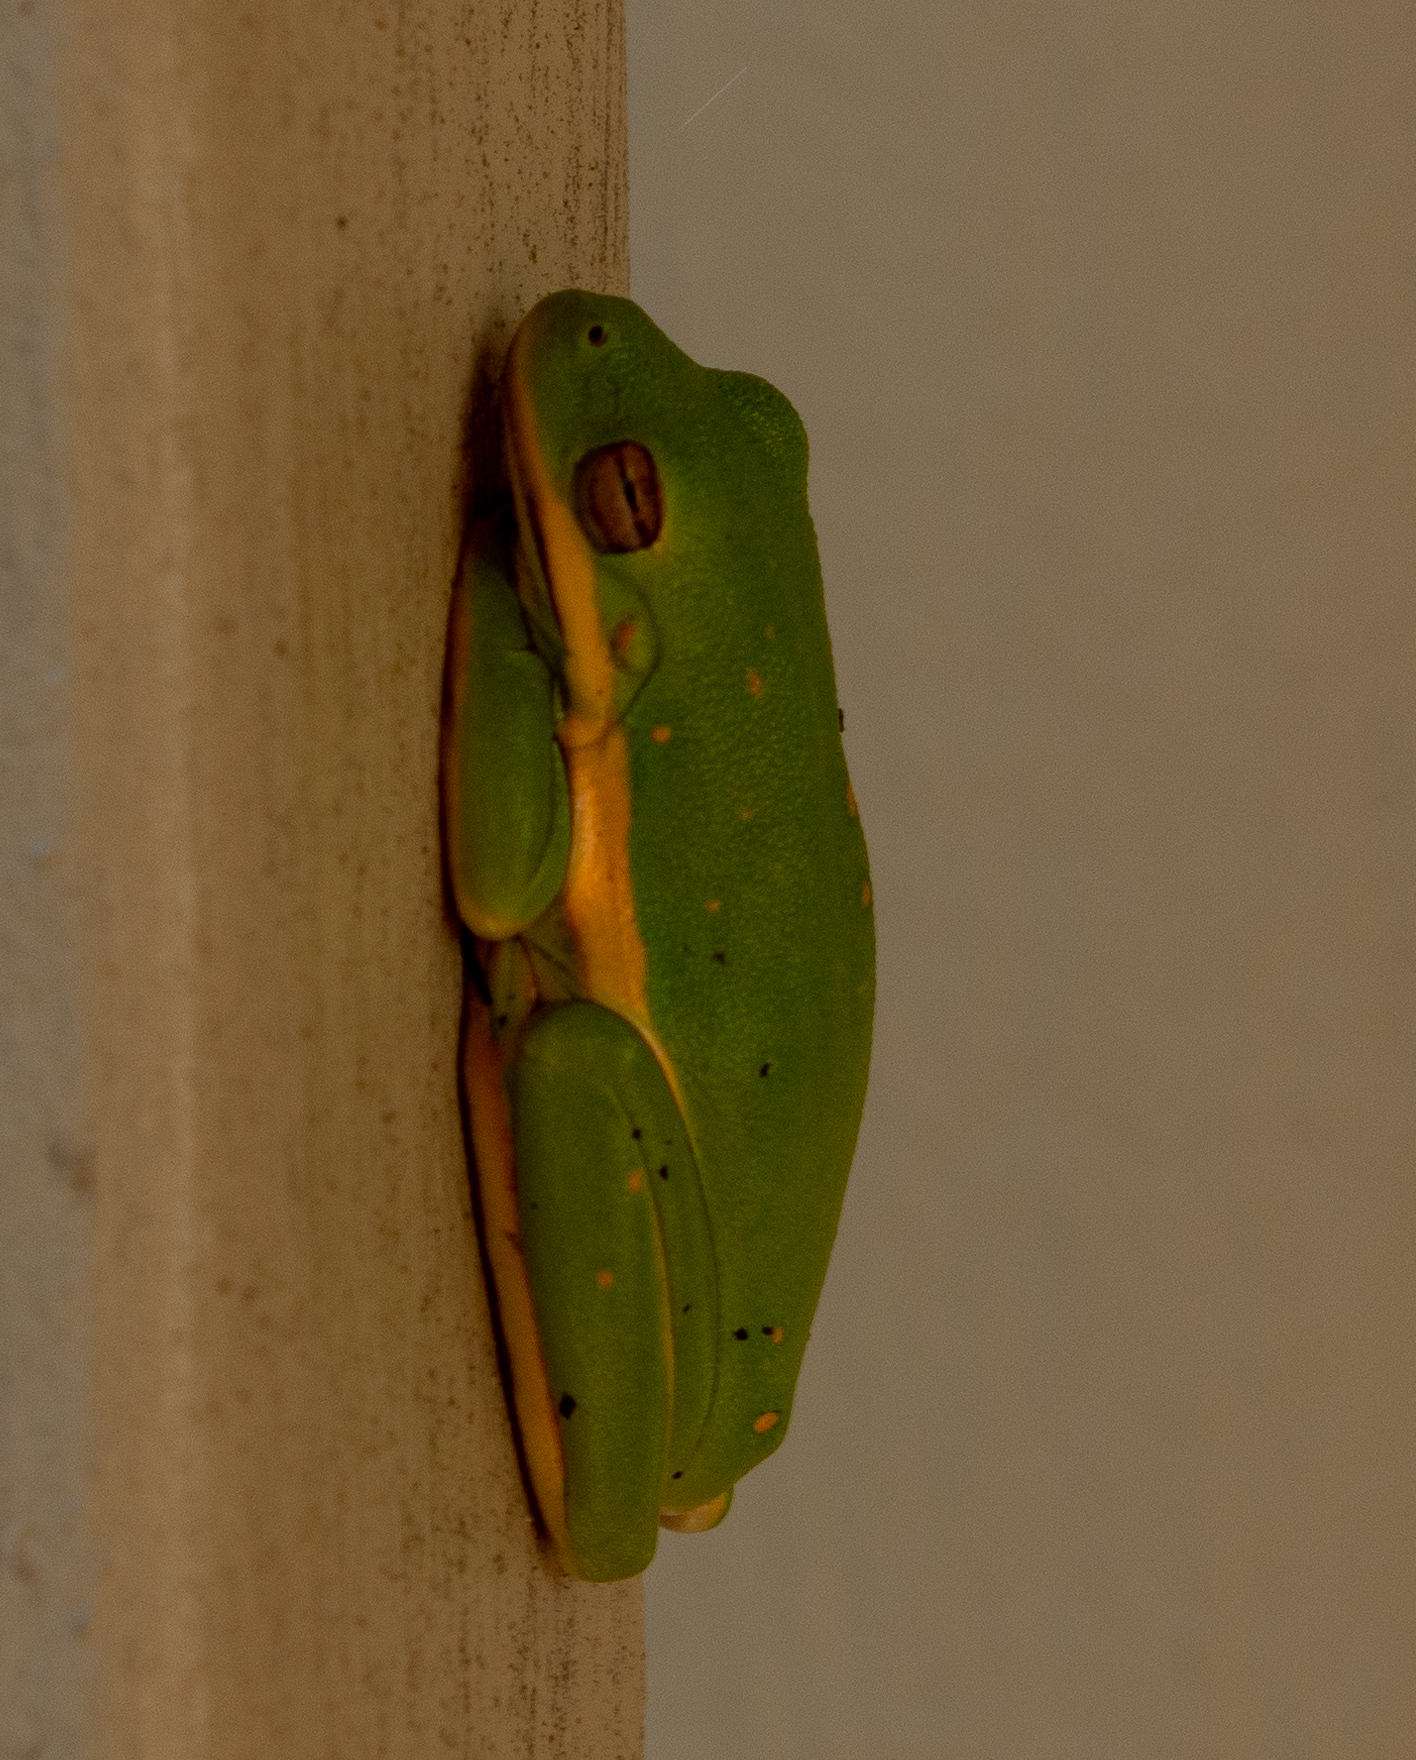
    A green tree frog resting on a post. This is a small green frog with a bright yellowish-white stripe running down the side of its body.
    A green tree frog resting on a post.

    Introduction

    The green tree frog (Hyla cinerea) is a bright green, average sized frog. Adults are about an inch or two long, with females typically being slightly larger than the males. Most green tree frogs have a white stripe down the middle of their bodies, like the frog shown above. However, a minority of frogs don’t have this stripe. Some individuals, like the one shown above, have yellowish dots on their bodies as well. A green tree frog’s coloration can vary based on their environment – some individuals are more yellow, gray, olive, or brownish. An individual’s coloration is affected by lighting, stress levels, and temperature. The photo above was taken in warmer lighting, which explains why the frog is more of a yellow green.

    Green tree frogs are found throughout the southeastern United States, with ranges in Texas, Louisiana, Arkansas, Mississippi, Alabama, Georgia, Florida, South Carolina, North Carolina, stretching all the way up into Virginia and Maryland.

    Habitat & Behavior

    Adult green tree frogs live in forested areas, which are located near freshwater access where they breed. These frogs become active in late spring each year, and go dormant in October. Frogs in the southern part of this range stay active all year, with frogs in the middle spending more time active than frogs in northern regions. You’re most likely to see these frogs active at night or at dusk, and you’re more likely to see an active green tree frog on a rainy day than a sunny one. While active, green tree frogs are most likely to be feeding, or moving to and from calling perches (used to signal nearby green tree frogs that they’re available for mating).

    Breeding

    Green tree frogs most often breed around permanent wetlands. Ponds, lakes, streams, and swamps are all common breeding grounds for green tree frogs. Human-built water structures are not off the table for breeding sites as well – you can often find breeding sites in all sorts of constructed water reserves. Breeding starts by one or a few males calling, with more males joining in the chorus. The chorus will swell as many males join, before going quiet. This cycle will continue for hours, from dusk into the early morning hours. There’s evidence that social signals between male green tree frogs have an impact on their testosterone and steroid levels, independent of calling behavior.


    References

    Burmeister, S., & Wilczynski, W. (2000). Social signals influence hormones independently of calling behavior in the treefrog (Hyla cinerea). Hormones and Behavior, 38(4), 201–209. https://doi.org/10.1006/hbeh.2000.1605

    Dodd, C. K. (2013). Frogs of the United States and Canada. In Frogs of the United States and Canada. John Hopkins University Press. https://doi.org/10.17161/randa.v20i3.13960

    Jennison, C. (n.d.). Species Profile: Green Treefrog (Hyla cinerea) | SREL Herpetology. Savannah River Ecology Laboratory University of Georgia. Retrieved September 29, 2021, from http://srelherp.uga.edu/anurans/hylcin.htm

  • Where do Great Blue Herons catch their snacks?

    Where do Great Blue Herons catch their snacks?

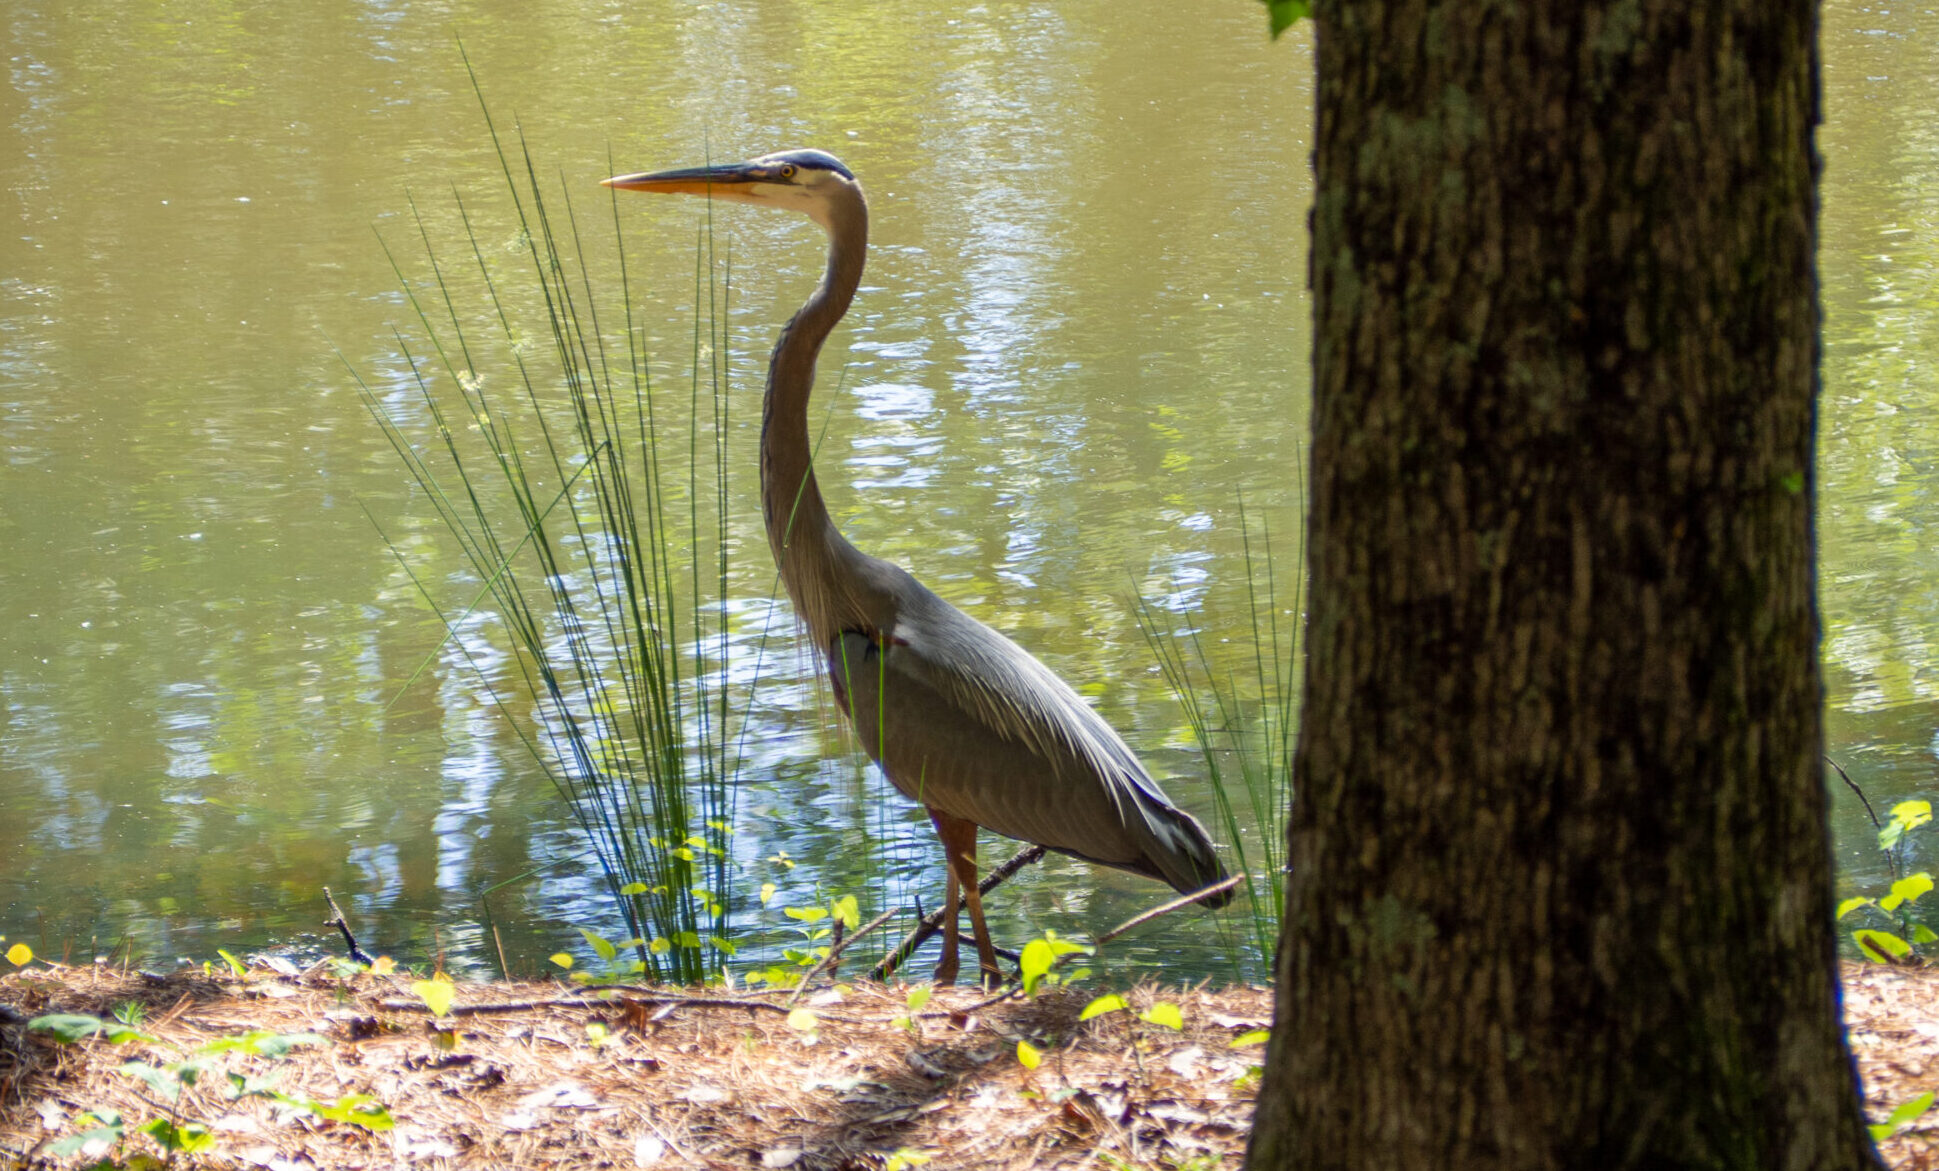
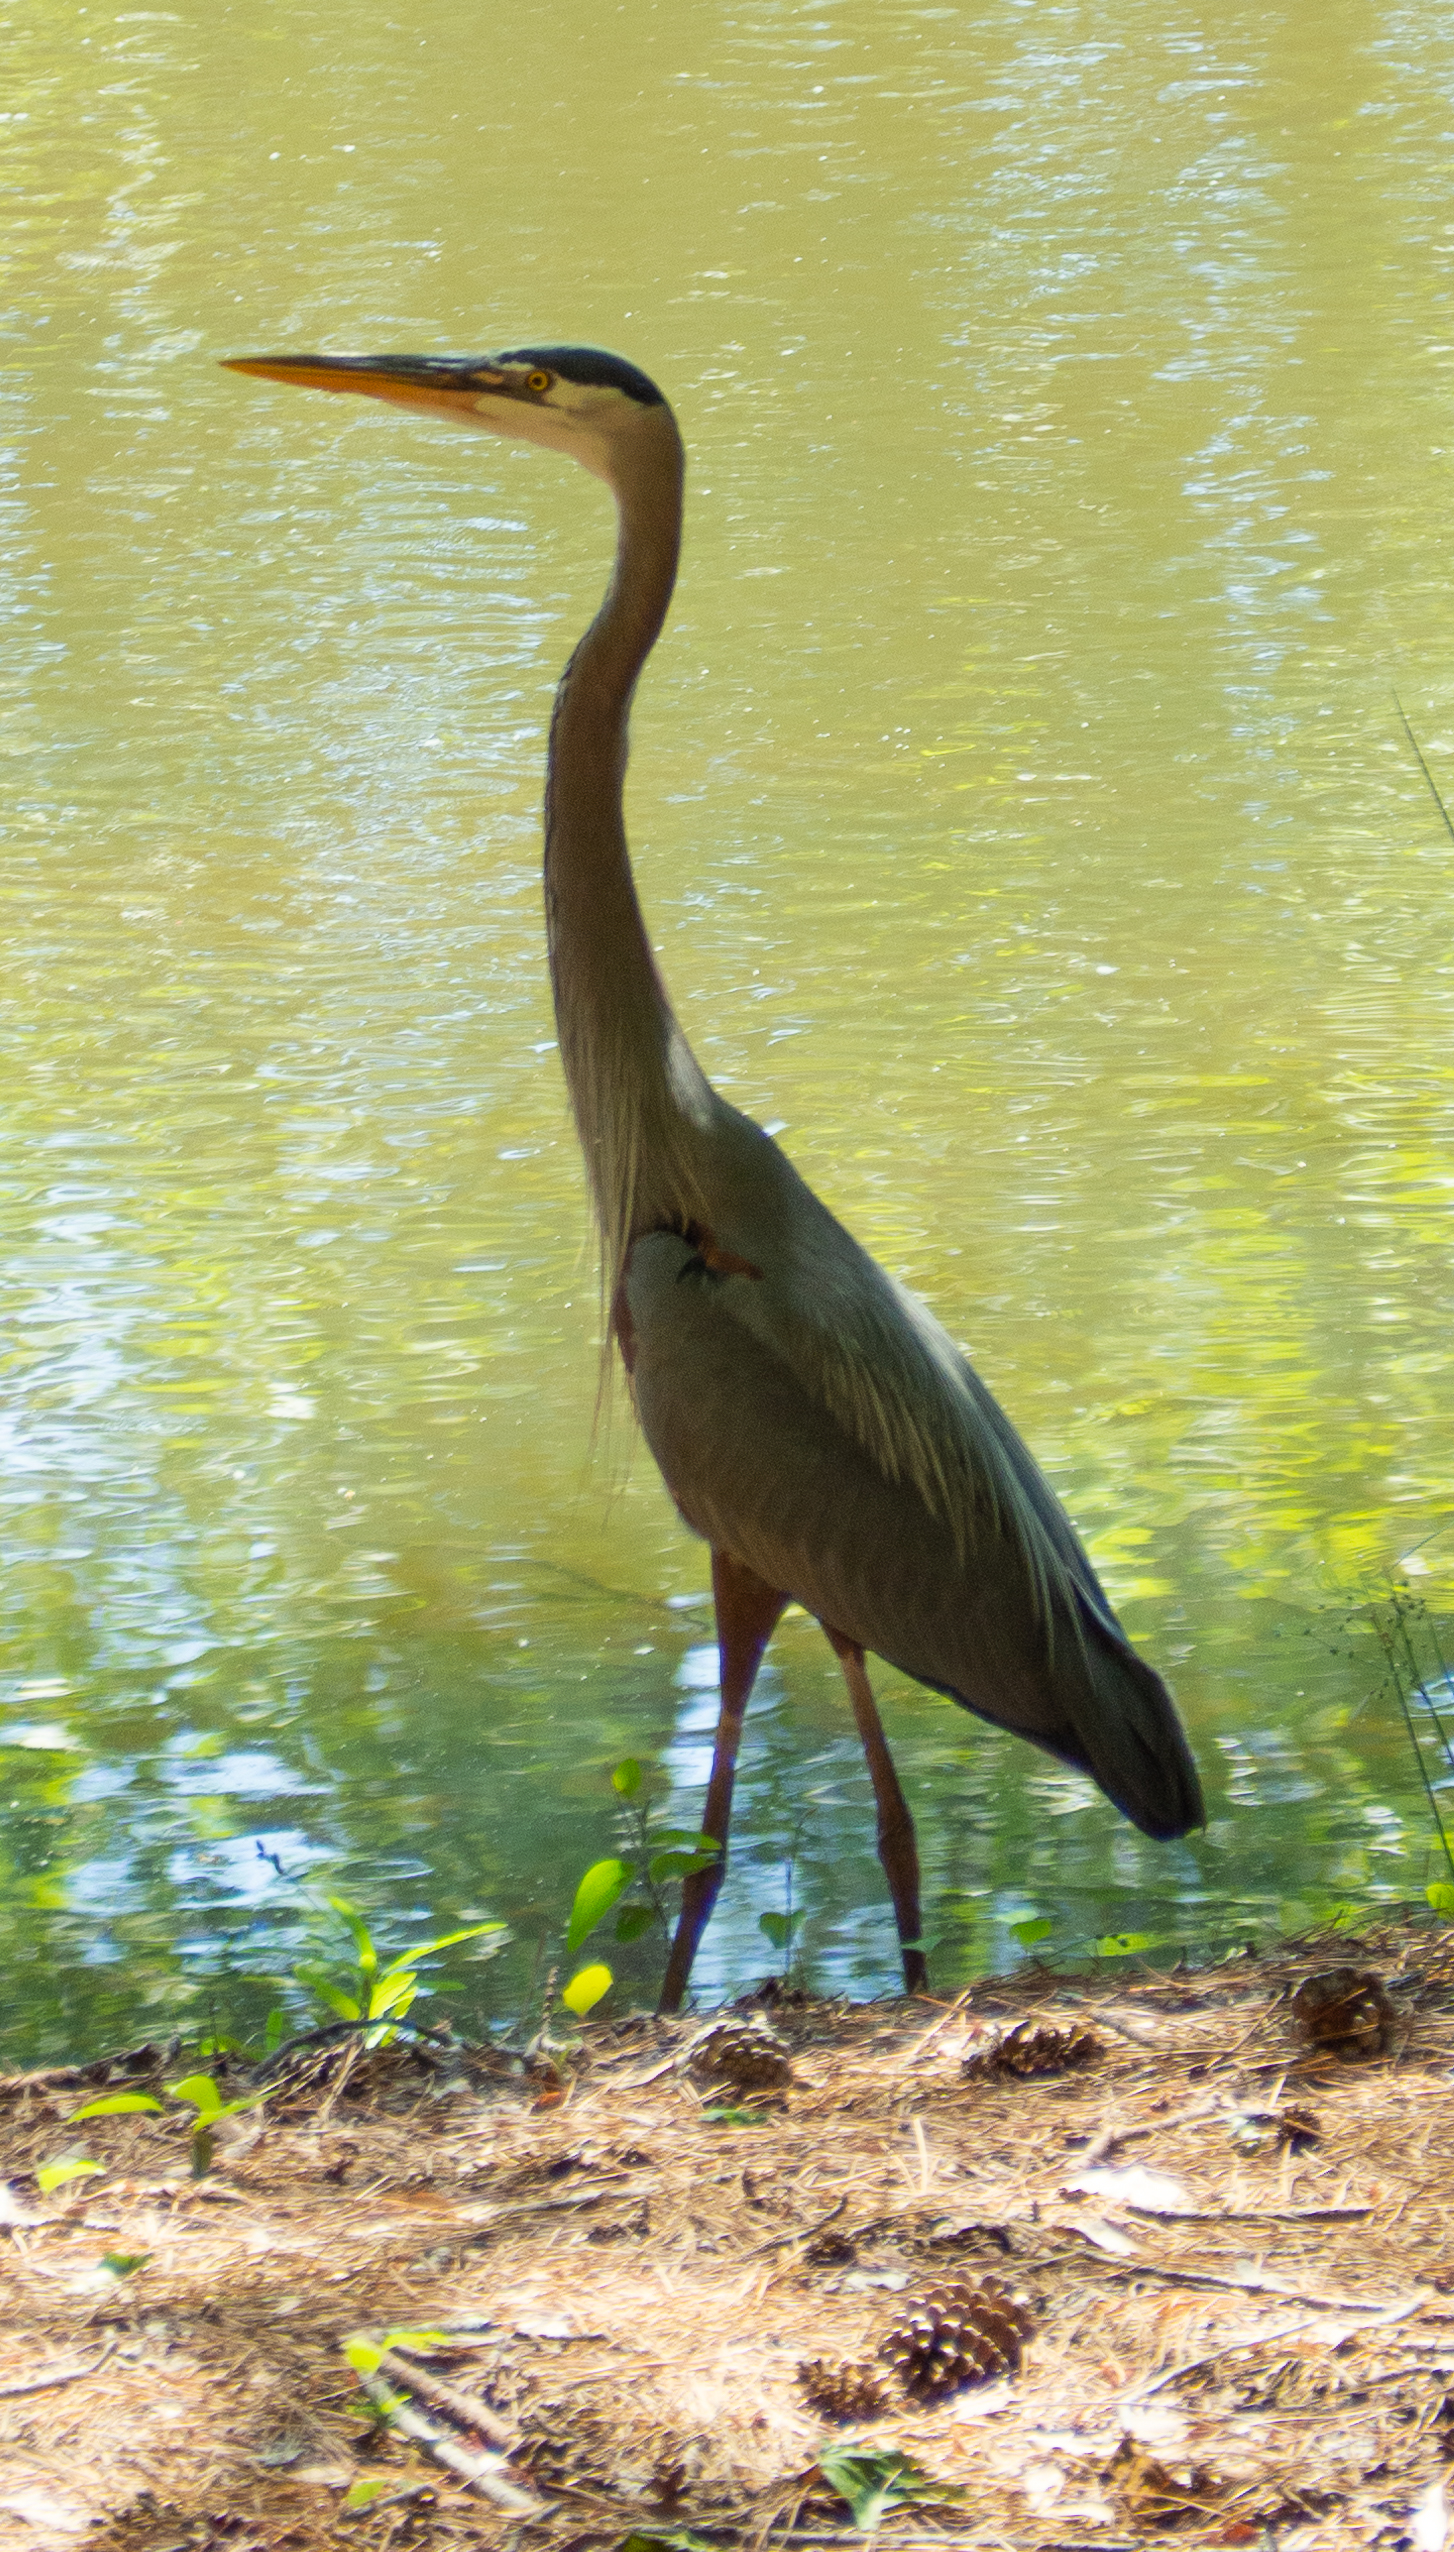
    A picture of a great blue heron. The heron is standing on the edge of a pond.

    Introduction

    Great blue herons are part of the Ardea genus, which is a genus of birds that includes the herons, egrets, and bitterns. These birds are typically pretty large in size, with lengths usually greater than 80–100 cm. You’re most likely to find members of this genus in wetlands and other partially aquatic habitats.

    Feeding Behavior

    Great blue herons are carnivores, and they eat a variety of aquatic, semi-aquatic, and terrestrial prey. Their diet consists of predominantly fish, but they will eat pretty much anything that they can catch in their beaks. Fish are supplemented by amphibians, reptiles, small ground mammals, and even other birds. Great blue herons catch smaller prey in the jaws at the back of their beak, although they prefer to stab larger prey with their beaks.

    There are 38 total feeding behaviors that have been recorded by members of the Ardea family. Each species in this genus uses multiple feeding methods — they’re creative hunters. Twelve of these strategies have been observed in great blue herons. The most commonly observed feeding behavior for the great blue heron is standing and waiting, where the heron simply stands still and waits for its prey to come to it. Herons also will move slowly, either through the water or through a field, in search of prey. More dramatically, the great blue heron will occasionally plunge-dive, diving down quickly and with force, to catch its prey. A particularly interesting feeding behavior of the great blue heron is to stick its bill in the water, and vibrate it. The underwater vibrations create ripples, attracting fish and other aquatic prey.

    Habitat

    Great blue herons prefer to live in wetlands, especially when nesting. Rather than nesting alone, great blue herons nest in colonies. Colony nesting is particularly common for birds that live in aquatic environments. Colonies can have over 500 nests (so easily over a thousand birds) all relatively close together. For large scale habitats and especially for colony nesting, great blue herons have preferences for certain types of habitats over others. The lacustrine wetlands is a particular favorite of Illinois great blue herons. Lacustrine wetlands are any wetland or deepwater area that has these three characteristics:

    1. Located in a valley/depression in the ground
    2. Lacking trees, shrubs, and other plant life that covers more than 30% of the area
    3. At least 20 acres in surface area

    Biologists believe that herons may prefer this biome for their habitats due to the easy access to their preferred prey of small bodied vertebrates. Additionally, large wetlands tend to be isolated from human activity, which great blue herons tend to avoid if possible.

    References

    Combs, B. P. (2021). Great Blue Heron Forages for Fish by Bill-Vibrating. Western North American Naturalist, 81(2), 280–284. https://doi.org/10.3398/064.081.0213

    Gibbs, J. P., & Kinkel, L. K. (1997). Determinants of the Size and Location of Great Blue Heron Colonies. Colonial Waterbirds, 20(1), 1–7. https://doi.org/10.2307/1521757

    Knight, E. C., Vennesland, R. G., & Winchester, N. N. (2016). Importance of Proximity to Foraging Areas for the Pacific Great Blue Heron (Ardea herodias fannini) Nesting in a Developed Landscape. Waterbirds, 39(2), 165–174. https://doi.org/10.1675/063.039.0207

  • Color Changing Lemonade

    Color Changing Lemonade

    Would you believe the drink above is lemonade, and the blue and purple colors are due to all natural ingredients? That’s right. The lemonade pictured is cooled with not-so-average ice cubes. These cubes are made from frozen butterfly pea flower tea. 

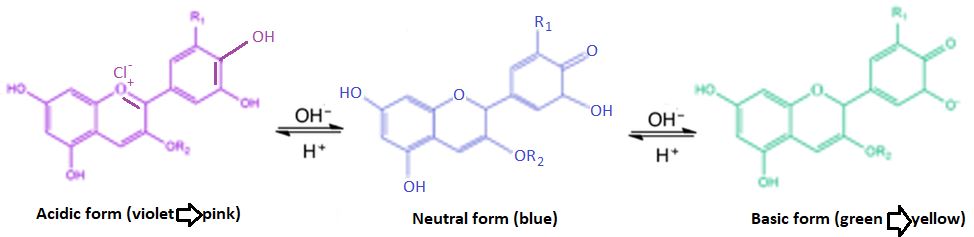
    Butterfly Pea flower tea is a popular non-caffeinated tea from Southeast Asia. It is made simply by steeping butterfly pea flowers in boiling water. Butterfly pea flowers get their deep blue hue from a natural compound called anthocyanin. This compound is the reason for the dark blue color of the ice cubes in the video above, and is also the reason for the amazing color change that occurs when the ice cubes come in contact with the acid from the lemon juice.

    Anthocyanin undergoes reversible chemical changes (shown above) when exposed to either acids or bases. The chemical change alters the chemical structure, which alters the way it absorbs different wavelengths of light. When anthocyanin is exposed to a base, it reflects green and then yellow, depending on the strength of the base. When anthocyanin is exposed to acid, it turns purple and then red, depending on the strength of the acid. Because lemons are acidic, the melted butterfly tea ice cubes turn purple!

    You can make this cool color changing drink at home with butterfly pea flowers and other normal household ingredients.

    Making the butterfly pea flower ice cubes is simple. Just steep about 4 to 5 butterfly pea flower tea bags, or 25 to 30 dried pea flowers, in about 2.5 cups of boiling water. You can choose to leave the teabags/flowers steeping for up to 30 minutes for concentrated color, but just 10 minutes will get you blue ice cubes that can definitely give you a beautiful color change.

    All that’s left is to make the lemon mix that will turn the ice cubes purple! Mix 1 cup of lemon juice with ¾ cups of sugar and stir until the sugar is completely dissolved. You can heat up the mixture a little to speed the mixing process.

    Next, take your frozen butterfly pea flower tea and put it in the blender or food processor to create shaved ice. If your blender is like mine and can only make crushed ice pieces, that’s okay, just make sure there is some melted tea in your glass to get the immediate color change effect. Fill your glass halfway with crushed or shaved butterfly pea flower ice, and then add the lemon mix! As the anthocyanin comes in contact with the acid from the lemon juice, it will turn a pretty purple color. If you have some bigger crushed butterfly pea flower ice pieces, they will stay blue and only turn purple as they melt, which will create a swirly blue/purple gradient effect. Fill the glass with your desired amount of lemon mix (I fill it about ⅓ full) and top the rest of the glass with club soda! And viola, you have your color changing lemonade!

    Citations

    Kodippili, D. (2020). Color Changing Lemonade Slushie (Galaxy Lemonade). The Flavor Bender. www.theflavorbender.com/galaxy-color-changing-lemonade-slushie/

    Kan, Viirj & Vargo, Emma & Machover, Noa & Ishii, Hiroshi & Pan, Serena & Chen, Weixuan & Kakehi, Yasuaki. (2016). Organic Primitives: Synthesis and Design of pH-Reactive Materials using Molecular I/O for Sensing, Actuation, and Interaction. 


  • Color Vision Deficiency and the new Glasses on Facebook

    Color Vision Deficiency and the new Glasses on Facebook

    Color vision deficiency, also known as colorblindness, is more common than one might think. 0.6 percent of women and 8 percent of men are born with colorblindness. The causes can be widespread, but the most common types of color vision deficiency are inherited.

    How do we see color, and what is the reason for color vision deficiency?

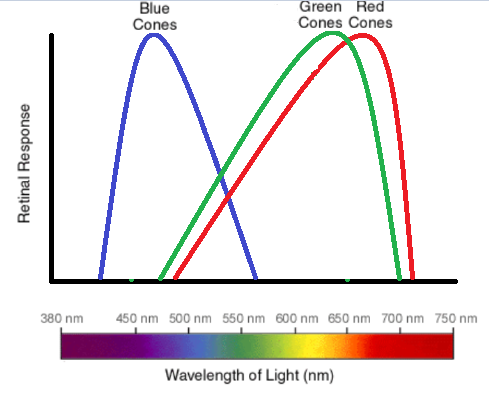
    Light, as a wave, enters the eye through the pupil, and lands on the retina, the collection of cells on the back of your eye. The retina has cells called cone cells and rod cells. Rod cells can be stimulated by a very small amount of light, however they have a molecule called rhodopsin in them, which cannot differentiate between different wavelengths. Cone cells require more light to be stimulated, but they have photopsin in them which can help our brains differentiate between the different wavelengths of light. This is why cone cells allow us to perceive color. All cone cells do not have the ability to differentiate all colors of light though. There are 3 types of cone cells, and each is stimulated by a different range of wavelengths due to the type of photopsin it possesses.

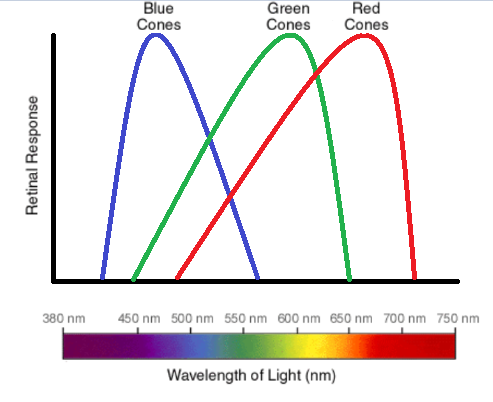
    Because the ranges overlap for some wavelengths, sometimes cones can work together to differentiate certain colors. For example, the wavelength 625 nm, which corresponds to the color yellow, stimulates both red cones and green cone cells. Both of these cell types accept the 625 nm wave and send the signal to your brain that allows you to perceive yellow.

    There are several different kinds of color blindness, and the different kinds can be brought about by different causes. Sometimes colorblindness is caused because there is an absence of one or more types of photopsin in the cone cells on the retina. Other times it is caused because the photopsin in the cone cells is absorbing a range of wavelengths that is abnormal.

    Dichromacy is a type of color blindness where the subjects only possess 2 of the 3 normal photopsin types. Protanopia is a condition where the subject has normal green and blue photopsin molecules, and defective or absent red photopsin molecules. Deuteranopia is a condition in which the subject has normal blue and red photopsin molecules, and defective or absent green photopsin molecules.

    Trichromacy is a condition in which subjects possess all three photopsin types, but one of more of the photopsin types on their retinas absorbs an abnormal wavelength range. One of the most common forms of colorblindness is red-green color vision deficiency. This is caused either when the wavelength absorption peak for the red photopsin molecules is shifted toward the lower wavelengths (i.e. closer to the green wavelength absorption peak), or when the green wavelength absorption peak gets shifted toward the higher wavelengths (i.e. closer to the red wavelength absorption peak). These abnormalities are called protanomaly and deuteranomaly, respectively, and both of them cause an individual to have a lower ability to distinguish the difference between red and green.

    The approximate retinal response of individuals with deuteranomaly. The retinal response of individuals with protanomaly looks similar, with the green and red cone peaks close together. This is what gives those individuals trouble with distinguishing differences between red and green colors. 

    If you’ve been on Facebook recently, you may have seen videos of the reactions of colorblind people putting on colorblind glasses. En-chroma is a brand that has popularized what they call “color blind lens technology”. The technology works by selectively excluding wavelengths of light where the red and green peaks overlap. These wavelengths stimulate both the green and red cones at high levels in individuals with protanomaly and deuteranomaly. Because the glasses filter out these wavelengths, it helps the individual to see more differences between red and green!

  • The Alien Equation

    The Alien Equation

    Throughout history, humanity’s view of the universe has changed drastically. For a long time, people believed that the Earth was all there was, with a dome high above it that had pinpricks they called stars. Later, they believed the solar system was the extent of the universe. Then that view expanded to the galaxy as we realized the pinpricks were actually other suns. Now, we believe there is a universe beyond even what we can observe, with other galaxies than our own populating space. When our understanding of the universe allowed us to understand that other stars exist, there began to be questions of extraterrestrial life around other stars and whether we on earth could somehow communicate with it. In the 1960’s, a man named Frank Drake wrote a book exploring the chances of life on other planets that was intelligent and capable of communicating with Earth in our galaxy. The book lead to an equation that expresses this chance numerically:

    N = R * f(g) * f(p) * n(e) * f(l) * f(i) * f(c) * L

    This equation has many terms that are not able to be calculated exactly, but they do lay extremely good groundwork for an estimate of intelligent, communicative life. This equation got experts talking about what they thought the odds for life in the universe could be and helped encourage the search for extraterrestrial life. This equation is also really easy to use to develop your own guess on the chances of extraterrestrial life. Breaking down this equation, there are three categories the values can be put into based on what factors they relate to. 


    Astronomically Based Values

    The first three values in the equation are values that are gained from observing the galaxy. They are astrophysical values that, with our current scientific capabilities, are reasonable to calculate somewhat accurately. The first value, R, is the rate of star formation in the galaxy. It can alternatively be the number of stars estimated to be in the galaxy. It is the starting point of the equation, as most of the other terms are fractions that whittle this value smaller and smaller as the criteria gets more specific. The current estimate of stars in the galaxy is between 100 and 400 billion stars. The second value, f(g), is an estimate of how many stars in the galaxy are suitable for hosting planets with life. Stars that can host planets with life must be long living and steady stars and they cannot have large fluctuations in temperatures and intensity. This value is currently estimated to be between 5 and 10 percent, meaning .05 to .1 for use in the equation The third value, f(p), is a measure of how many of those suitable stars actually have planetary systems. For example, stars that are in binary systems are thought to very rarely host planetary systems. This value is often estimated at about .5, as about 50% of star systems are binaries or multistar systems and the other 50% are single stars. 


    Biologically Based Values

    The next three values of the Drake equation are based on biological factors with life. The first one, n(e), is how many planets per star system are suitable for life. This mainly means how many planets are in the habitable zone of a star. The habitable zone is the distance from a star where planets can have water in all three phases, solid, liquid, and gas. The value to plug into the question can be found by taking your estimate of the number of planets in the habitable zone and dividing it by the estimated total number of planets in the system. For a system like our solar system, this would be .125. The next value, f(l), is the fraction of planets in the habitable zone that will actually have life form. This is where the values in the equation begin to vary greatly from person to person. Some people argue that if life can form it will and put this value at 1. Others argue that life is extremely rare to happen, putting the value closer to .001, or even smaller. Since we have so little understanding of how life started on Earth, it is hard to estimate its rarity in other places.  The final value, f(i), is the fraction of cases in which life develops intelligence. Once again, this is a controversial value to choose. Currently, we don’t know if life always evolves to intelligence. It can be argued that we did, so why wouldn’t other planets? However there have also been millions of species on our planet, and only one has evolved to our level of intelligence: humans. With those odds, intelligence seems rare. 


    Sociological Based Values

    The last two values of the Drake equation are sociological factors. The first one, f(c), is the number of intelligent races that have the technological capability and desire to try and communicate with other species. An example of this coming into play may be with an intelligent species that lives underwater. It would be difficult, if not impossible, for them to invent electronic devices like ours, and things like radio telescopes to communicate with might never be designed by them. Experts tend to estimate this as a fairly large value because it is thought by many that upon developing intelligence, a species will continually improve their technology. This is believed to always lead to communication technology in the process. The exception to this are species that face rare environmental factors that dissuade the invention of specific types of technologies, such as the underwater species example. The last value, L, is the lifetime of a civilization. This is as simple as it sounds. This value is necessary because we live so far from other planets that it would take a very long time to communicate with them. The very long time it takes to send a message means there needs to be long standing civilizations to continue any conversations, otherwise they would not be able to truly communicate with us. This value is often estimated to be between 1,000 and 100,000,000 years. 


    Concluding Thoughts

    Current estimates of the value calculated from the Drake equation range from as low as .00000000000091 to 15,600,000 planets that host intelligent, communicative life. The value can be much larger or lower than this as well, but there is no “correct” answer. You can find your own solution by plugging in values that you think are true. All you have to do is start with the number of stars in the galaxy and fill in what fractions you believe fit for the other values, and choose a lifetime to use. If your answer is greater than 1, your chosen parameters suggest that life exists elsewhere in our galaxy. However, if your answer is less than 1, your parameters suggest that we are likely alone in the galaxy. As long as you can give a reason for the values you chose, you have created your own theory for life in the universe.


    Burchell, M. (2006). W(h)ither the Drake equation? International Journal of Astrobiology, 5(3), 243-250. doi:10.1017/S1473550406003107

    Drake, F.; Sobel, D. (1992). Is Anyone Out There? The Scientific Search for Extraterrestrial Intelligence. Delta. pp. 55–62. ISBN 0-385-31122-2.

  • Rethinking Radiation

    Rethinking Radiation

    In 1896, the French scientist Henri Becquerel observed spontaneous emissions from uranium and called this phenomenon radiation. The first recorded radiation treatment occurred the same year. Early successful uses of radiation to treat various illnesses and ailments captured the public imagination—everyone hoped their bodily problems could be cured with these seemingly limitless materials.

    Marie Curie’s discovery of radium in 1898 also fascinated the public. Its radioluminescence gave it a magical quality, and companies were quick to churn out radium-infused health and wellness products including toothpastes, soaps, beauty creams, and radium pads that could be placed on afflicted body parts. Liquid sunshine cocktails, or radium-infused beverages, became a health fad in the early 1900s. Upper-class consumers in cities around the world were eager to get their hands on these energizing elixirs which were advertised as all-purpose cures.

    The public’s love affair with radium fizzled out as reports rolled in of painful diseases and deaths associated with radiation poisoning. One of the most famous examples was the 1920s Radium Girls case. Many women working at clock factories developed osteonecrosis (bone tissue death) and osteosarcomas (bone tumors) around their jaws along with other painful conditions. Over a dozen of the women died. Investigators discovered that the women were interacting with toxic levels of radium by constantly pointing brushes on their lips—the brushes being covered in glow-in-the-dark radium paint, of course.

    Eventually, the FDA and FTC (and health officials in other countries) cracked down on the use of radium in consumer products as awareness of radiation poisoning grew. The dangers of radioactive materials overtook the public consciousness in 1945 when the devastation of America’s atomic bombs was revealed. Subsequent studies on radiation and nuclear accidents Three Mile Island (1979) and Chernobyl (1986) further solidified fears of radiation and hindered the development of nuclear medicine.

    This is because we are operating under the linear no-threshold (LNT) radiation paradigm, which is based on the ideas that all radiation exposure levels are harmful and each increment of exposure adds to the overall risk of negative health effects. However, a different paradigm emerged in the 1990s. Radiation hormesis, which is still very controversial, is based on the ideas that low levels of radiation exposure produce different effects than high-level exposure. In fact, small doses of radiation may improve health! 

    Some scientists believe in this paradigm because the body has already evolved to protect DNA against low-level radiation that occurs naturally. Free radical scavengers are a type of radioprotector molecule that can repair the loss of electrons or hydrogen atoms. This naturally occurs in cellular molecules due to metabolic processes but is also caused by radiation exposure. Free radical scavengers can repair this low-level radiation damage. Another concern with radiation is DNA mutation. It is estimated that 10,000 genetic modifications already happen every hour in your body! Whether the cause is a natural error or low-level radiation exposure, enzymes are constantly checking and repairing DNA. Low-level radiation exposure can also cause cell death during reproduction and interphase. Instead of viewing this as a harmful effect, radiation hormesis interprets this as a positive strategy for the body to prevent damaged cells from reproducing.

    This controversial framework is supported by several studies. Among atomic bomb survivors, those exposed to low levels of radiation experience a lower rate of leukemia than average people. This is contrasted by the higher rate of leukemia among survivors exposed to high levels of radiation. Under the LNT paradigm, we expect the leukemia rate to be higher than average even among survivors exposed to low levels of radiation, which is not the case. 

    Other experimental studies demonstrate health benefits from low doses of radiation including reducing the likelihood of neoplastic transformation (when cells begin to grow abnormally or excessively, which can be benign or cancerous), activating enzymes and mechanisms that protect and repair DNA, and stimulating the immune system. Again, the LNT paradigm leads us to expect the opposite results, that even low-level radiation would negatively impact these areas of health.

    So what does radiation hormesis really tell us? Is it okay to guzzle liquid sunshine cocktails again if the radium dose is small enough? Let’s hold off on that…in the meantime, we can take inspiration from the radiation hormesis framework and curb our knee-jerk negative reaction to anything involving radiation. Who knows what will be discovered if we open our minds to the possibilities of nuclear medicine and nuclear energy! 

    (Reminder: refrain from immediately ingesting any new discoveries…)


    Holcomb, W. F. (1999). Humanity and radiation: The good, the bad, and the unusual. Military Medicine, 164(7), 520-5. Retrieved from https://go.openathens.net/redirector/gatech.edu?url=https://search.proquest.com/scholarly-journals/humanity-radiation-good-bad-unusual/docview/217055431/se-2?accountid=11107

    Jolly, D., & Meyer, J. (2009). A brief review of radiation hormesis. Australasian Physical & Engineering Sciences in Medicine, 32(4), 180-7. Retrieved from https://go.openathens.net/redirector/gatech.edu?url=https://search.proquest.com/scholarly-journals/brief-review-radiation-hormesis/docview/204630213/se-2?accountid=11107

    Prekeges, J. L. (2003). Radiation hormesis, or, could all that radiation be good for us? Journal of Nuclear Medicine Technology, 31(2), 11-7. Retrieved from https://go.openathens.net/redirector/gatech.edu?url=https://search.proquest.com/scholarly-journals/radiation-hormesis-could-all-that-be-good-us/docview/218635974/se-2?accountid=11107