Category: Articles

  • I Got My Brain Scanned for Science

    I Got My Brain Scanned for Science

    Yeah, I got my brain scanned for science. And you should too! (If you’re eligible, that is.)

    Basically, I got an MRI scan of my brain done recently as part of a study at the GT/GSU Center for Advanced Brain Imaging (CABI). And while I was kind of nervous about the process, I wanted to write about the experience to help other people. If you’re about to get an MRI scan for medical reasons or for a study, I hope this article can relieve any fears or answer any questions you might have!

    So, what is an MRI? MRI stands for Magnetic Resonance Imaging. An MRI machine looks like a very large tube with a donut sized hole on the end. During an MRI, you lay down in front of the donut and the technician moves you into the machine. By using magnets, the machine is able to take 3D images of your organs (in my case, my brain!). Since an MRI is so detailed and there’s no radiation risk, it is often used by doctors to detect tumors and look at brain injuries. There’s a version of an MRI called an fMRI, which shows which areas of your brain are activated. The f in fMRI stands for function, and fMRI images are able to help scientists understand how we think.

    Since an MRI uses a really powerful magnet, you can’t bring anything metal in there. So, people with pacemakers, metal stents, braces, etc. might not be able to get an MRI. And when I say a powerful magnet, I mean it. The MRI machine at CABI is behind a heavy, access locked door with two large signs looking like the one on the right:
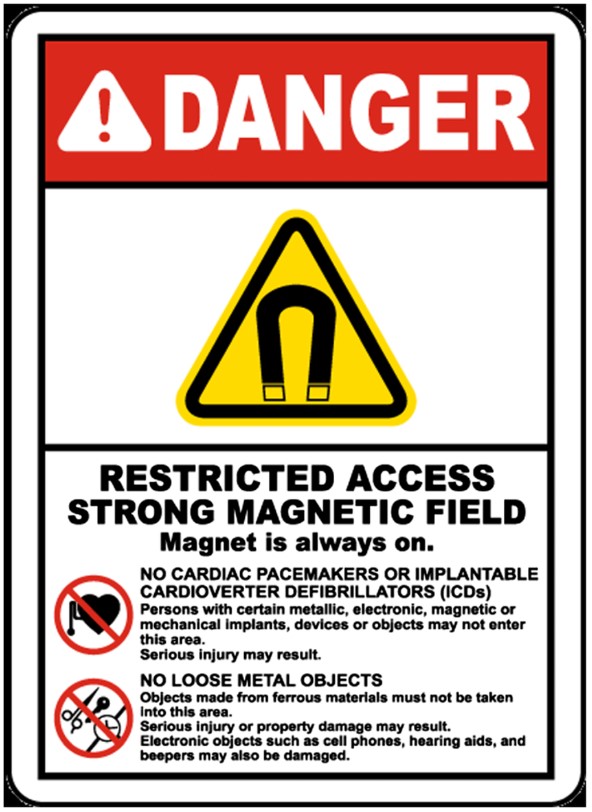
    A danger sign with a red header saying danger. Underneath is a yellow triangle with a magnet symbol indicating a strong magnetic field.And if you have a morbid curiosity as to what would happen if you did bring in metal on or in you, check out this video: MRI vs Metal Coins (American Currency) DO NOT ATTEMPT To Replicate. Notice that just by being near the MRI, the camera goes all wonky. Some other metal things that you might not consider:

    • Some tattoo inks that include metal
    • Earrings
    • Hearing implants
    • Magnetic eyelashes
    • Those metal fasteners on pants

    If you have any of these, it doesn’t mean you’re automatically disqualified from getting an MRI, but it’s important to bring it up to the technician or radiologist.

    After I made sure I was metal free, I stepped into the MRI control room. There was a giant window where the researchers and technician would be able to see me laying in the MRI in the next room. I took off my jacket and shoes, feeling a bit jittery now. I was going to be INSIDE that giant thing.

    The research assistant made her way over to me with a Vitamin E capsule and some tape. At my confused look, she explained, “Vitamin E shows up really brightly on the MRI, so we are gonna put this on your left forehead. That way, when the scans come in, we can tell which side is the left.” Makes sense to me. But that didn’t make it feel less weird when I put it on my head.

    The technician led me into the MRI room, where I laid down on the extended platform. It felt like the kind of examination table they have at the doctor’s office, but it was more padded. That was to discourage people from moving around and messing up the scan. After I laid down, I felt the technician place down more padding around my head and feet. She also gave me earplugs and a bulb that I was supposed to squeeze if I needed anything once I was in the machine. As she did all this and wheeled me into the darkness of the machine, she told me what she was doing. This helped calm my nerves a lot, considering I couldn’t see what was going on. 

    Finally, the technician turned the machine on, and I immediately appreciated the earplugs. The beeping reminded me of an alarm clock. I heard that some people can fall asleep during an MRI, but that wasn’t me. It wasn’t earsplitting, but just loud enough that it never faded into the background.

    My earplugs were attached to an earpiece. After a burst of static, I heard the research assistant over the beeps. 

    “Okay, we’re going to do the first part of the MRI and take a picture of your brain’s structure. Do you feel okay?”

    I nodded. There was a pause. “Wait, sorry,” I said, smiling sheepishly to myself in the dark of the machine. Obviously, they couldn’t see me. “Yes, I’m all ready.”

    The actual imaging itself was boring, but I passed the time imagining the magnetic beam hitting all of my cells. After a while, I could almost feel the beam on my skin. There wasn’t actually anything, of course. Then, the fMRI was done. The beeping was a different rhythm–more pleasant, in my opinion.

    While the scan was being performed, I completed a memory task as part of the study. A screen was put in front of me while I was still in the scanner, with the image projected from a computer screen in the control room using some mirrors. Using a control pad of buttons, I was even able to manipulate what was on the screen. I didn’t even know you could do all that while in an MRI machine!

    Soon, I was able to be released from the dark void I had been in previously. The whole process took around half an hour–much shorter than I expected. Other than some numbness from staying as still as possible, I felt alright. And I was excited to see what my brain really looked like!
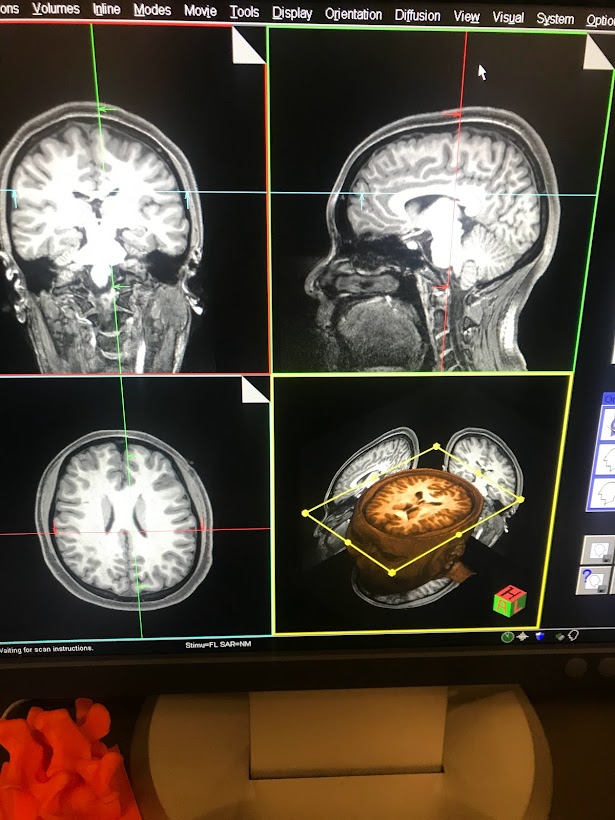
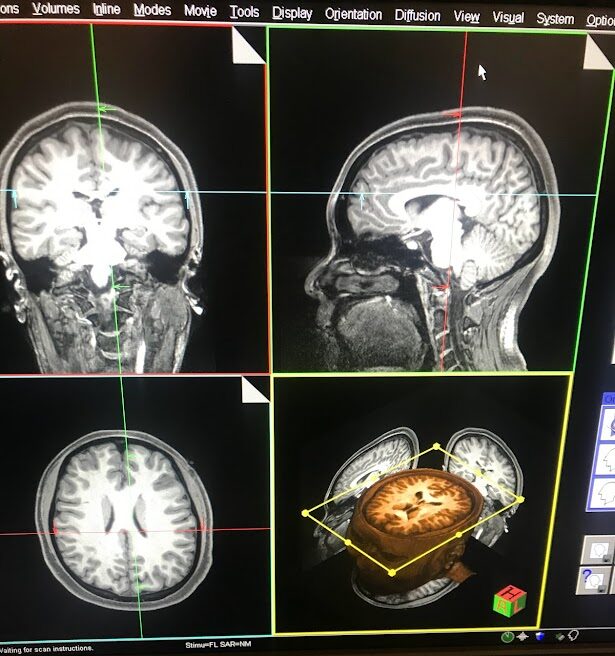
    A picture of my MRI scan from the coronal, sagittal, and horizontal views.
    This is my brain! From the top left going counterclockwise, that is the coronal view, horizontal view, and sagittal view. The bottom right shows all the slices of my brain that were taken, which you can see by moving the yellow lines.

    And there it was–all of my consciousness, my memories, my thoughts, my emotions, dreams, fears all up on that screen. It looked so complicated and fragile and beautiful. As a neuroscience major, I saw pictures of brains every day. But nothing hits quite like seeing your own brain up there in black and white. And there I was, using my brain to understand that what I saw in front of me was itself. It’s such an indescribable feeling!

    And that reason, beyond just the contributions to science, is why I recommend getting an MRI done as part of a study. After this experience, I felt myself thinking about my own brain with more affection. This squishy, bumpy organ is me, and I should treat it with the study and love that it deserves.


    References

    https://www.researchgate.net/figure/Magnetic-field-warning-sign_fig1_345758192
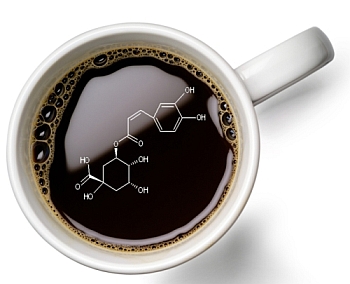
  • Coffee Chemistry

    Coffee Chemistry

    Written by Julia Raver and Lauren Mellinger

    Coffee – an integral part of your morning routine. You wake up and groggily walk to the kitchen to make your morning cup. It has become so integral to our morning routine that a lot of people can’t function without it. Especially in the mornings, having your order messed up at Starbucks or Dunkin Donuts can change the trajectory of your entire day. But how does coffee keep you awake all day? Caffeine is the secret to coffee’s success. 


    Part 1 – The Chemistry

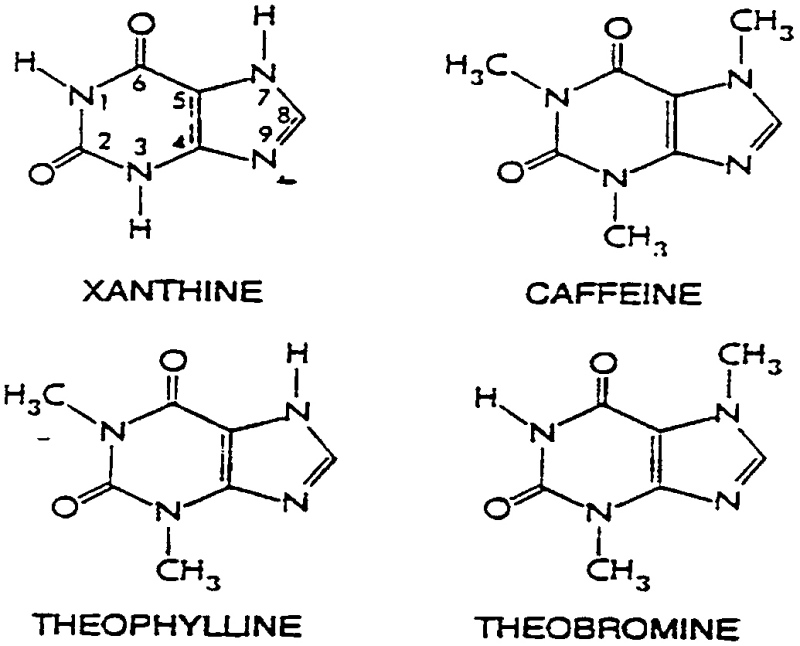
    Caffeine, or C8H10N4O2, is a drug known for its ability to give you energy and boost metabolism. It functions very similarly to xanthine, which is a crystalline drug that is often found in chocolates and teas. This provides an increase in stimulation and wakefulness, the ability to sustain intellectual activity, and decrease in reaction times. In the image below, you can see the similarities between the xanthine and caffeine molecules. The main differences are that caffeine has extra methyl (or CH3 groups) attached to its two rings (National Academy Press, 2001).

    Due to the polarity in caffeine molecules, or difference in strength between the nitrogen and oxygen bonds, caffeine exhibits unique bonding forces. It can bond via dipole-dipole forces, where positive and negative atoms of different molecules bond together. Caffeine also bonds via hydrogen bonding with water, which is a strong bonding of hydrogen atoms with carbon atoms of water and caffeine respectively. In layman’s terms, caffeine reacts in the bloodstream by bonding via its nitrogen and oxygen atoms. 

    Absorption in the Bloodstream

    We can now dive deeper into how caffeine is absorbed in the bloodstream. People absorb caffeine within 45 minutes of ingestion but has an elimination half-life of anywhere from 1.5 to 9.5 hours. This means that if you drink your morning coffee at 8 am, it could still be in your system at 5:30! When absorbed, caffeine undergoes the hepatic first-pass effect, meaning it is not removed by the liver and heads straight for the bloodstream. There, due to the presence of carbons within the structure, caffeine acts as a hydrophilic (or water-liking) molecule and can bond with the water in your tissues. Once bonded with this tissue water, caffeine works with proteins and begin to give you that energy boost you so desperately needed when you drank it at 7am (National Academy Press, 2001). 

    Now remembering that caffeine is in fact a drug, it is important to note that it also comes with a certain toxicity level. Luckily for coffee drinkers however, caffeine only becomes fatal when around 10-14g are ingested daily. To get an idea of how much this really is, divide 150 or 200 by your total body weight in kilograms. This gives the toxicity level based on your weight per day (National Academy Press, 2001). For example, if you weigh 110 pounds (or 50kg), 7500 milligrams or 7.5 g of caffeine is your daily toxic dosage of caffeine. An average cup of coffee contains around 100 mg of caffeine so you would need to drink 75 cups of coffee in a day to die of caffeine overdose (Dews, 1982).

    Caffeine Appearance

    Caffeine is what helps coffee give you energy in the morning but what makes coffee look and taste how it does? Melanoidin, or heterogeneous polymer with a brown pigment, is formed when sugars and amino acids combine at high temperatures (Merriam-Webster). This melanoidin is what gives coffee its nice rich brown color. Depending on the temperature to which the coffee beans are heated, the coffee can taste differently. Once heated above 180 °C, exothermic reactions (that release heat) within coffee beans occur (Rao, Fuller, & Grim, 2020). 

    The reactions occurring at these high temperatures are called Maillard reactions, which are defined as reactions between amino acids and sugars. Basically, sugars and amino acids reacted at high temperatures produce brown products, or these melanoidin molecules that create brown pigments (Ellis, 1959). Therefore, different roasting temperatures cause these reactions to go to either more or less completion and are responsible for both the color and taste of your morning beverage. Now that we understand the chemistry behind caffeine, we can look at flavor preferences.


    Part 2 – The Psychology

    Cold beverages have accounted for 75% of Starbucks’ sales in the past quarter (Creswell, 2022). All across the world, coffee drinkers prefer the mellow, balanced flavors of cold coffees. Hot coffee, on the other hand, can only be enjoyed for the fleeting moments between scalding and sour. But why is it that the same beans can produce such different flavors?

    The Making

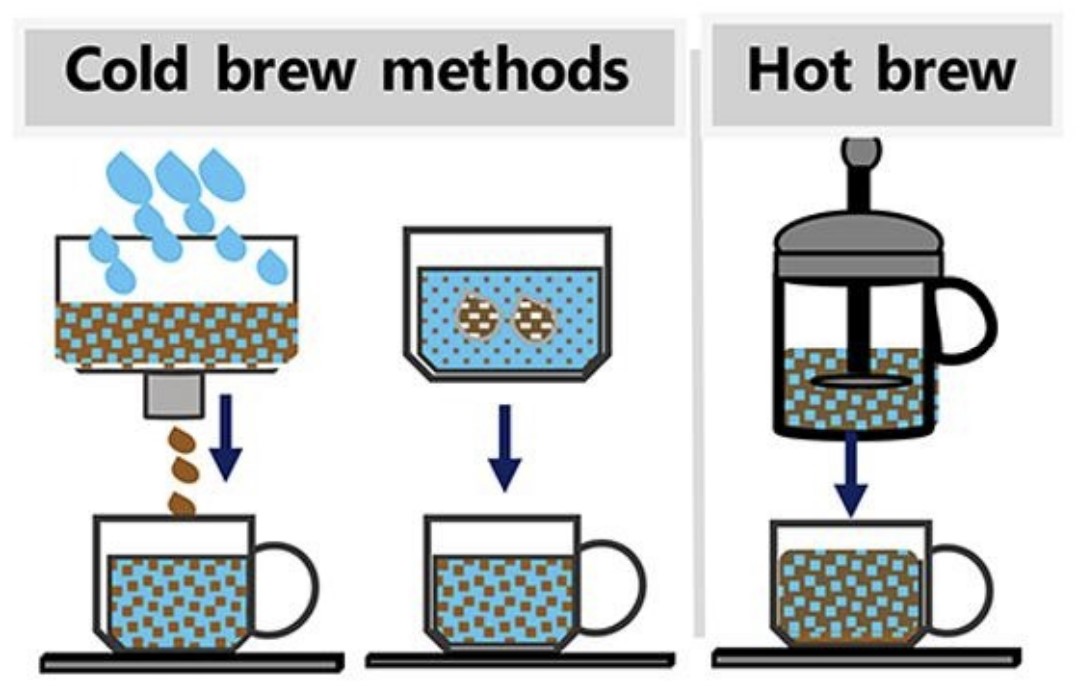
    The final cup of coffee is affected by the extraction method — the way water pulls flavor, aroma, and caffeine from the grounds. This is strongly influenced by temperature and time.

    For example, in a pour over, water moves over the coffee and produces a brighter tasting coffee. Immersion brews result in a fuller extraction leaving more body in the cup (Kelly, 2018). The cold brew method taking the coffee world by storm involves lower temperatures than your typical drip coffee. To compensate, it needs a much longer extraction time (between 8 and 24 hours) (Córdoba et al., 2021).

    Coffee and the Senses

    The ability of substances to dissolve out of the grounds and into the water increases with temperature. This causes acids to extract more efficiently in hot brewing. In turn, more sour and bitter elements are released. (Córdoba et al., 2021). Using a lower temperature better retains those delicate flavor components that would degrade or evaporate with exposure to heat (Lane et al., n.d.). Plus, hours of contact with water causes the fats in the beans to emulsify, creating that creamy mouthfeel. Therefore, higher temperatures lead to more nutty, roasty notes — and possibly some unsavory ones as well. Colder temperatures retain flavor compounds and generate a smoother, sweeter beverage (Córdoba et al., 2019).

    When you walk into a coffee shop, you are guaranteed to be welcomed by the scent of roasted beans. But you might notice that your cup of cold brew doesn’t smell very strong at all. Since the oils that carry aromas remain in the water, they stay in your coffee. You’ll perceive these as cold brew’s characteristic floral and fruity flavor (Oden, n.d.). Your drink might not have a strong fragrance or bite, but cold brew rewards those who wait (Alkin, 2014).

    Is Cold Brew Better?

    The novel brewing method also extracts more caffeine with time, which means cold brew is a concentrate. This allows coffee drinkers to adjusted it to their preferred strength and endlessly customize it to their liking. In addition, the lack of acidity may mean cold brew is a better alternative for those with sensitive teeth, heartburn, or GI issues (Rao & Fuller, 2018).

    Whether you crave the smokiness of an automatic drip, or the natural sweetness from an hours-long immersion, ultimately, the choice of brew is up to you.


    Reference List

    • https://www.scienceandfood.org/coffee-brewing-chemistry-hot-brew-and-cold-brew/
    • https://www.sciencedirect.com/science/article/pii/S0924224419305692
    • https://www.nytimes.com/2022/08/02/business/starbucks-quarterly-earnings.html
    • https://www.sciencedirect.com/science/article/pii/S0963996921000387
    • https://www.sciencedirect.com/science/article/pii/S0023643821005168
    • https://doi.org/10.1146/annurev.nu.02.070182.001543
    • https://doi.org/10.1016/s0096-5332(08)60223-4
    • https://blog.lacolombe.com/2018/09/19/brewing-method-affects taste/#:~:text=Immersion%20and%20pourover%20brewing%20each,%E2%80%9D%2Dtasting%2C%20brighter%20coffee
    • https://journals.uvic.ca/index.php/arbutus/article/view/16816
    • https://www.merriam-webster.com/medical/melanoidin
    • https://www.ncbi.nlm.nih.gov/books/NBK223808/
    • https://www.javapresse.com/blogs/cold-brew/hot-brewed-vs-cold-brewed-coffee
    • https://www.nature.com/articles/s41598-018-34392-w
    • https://doi.org/10.3390/foods9070902


  • The Little Engineer That Could: Turning Data Into Fashion

    The Little Engineer That Could: Turning Data Into Fashion

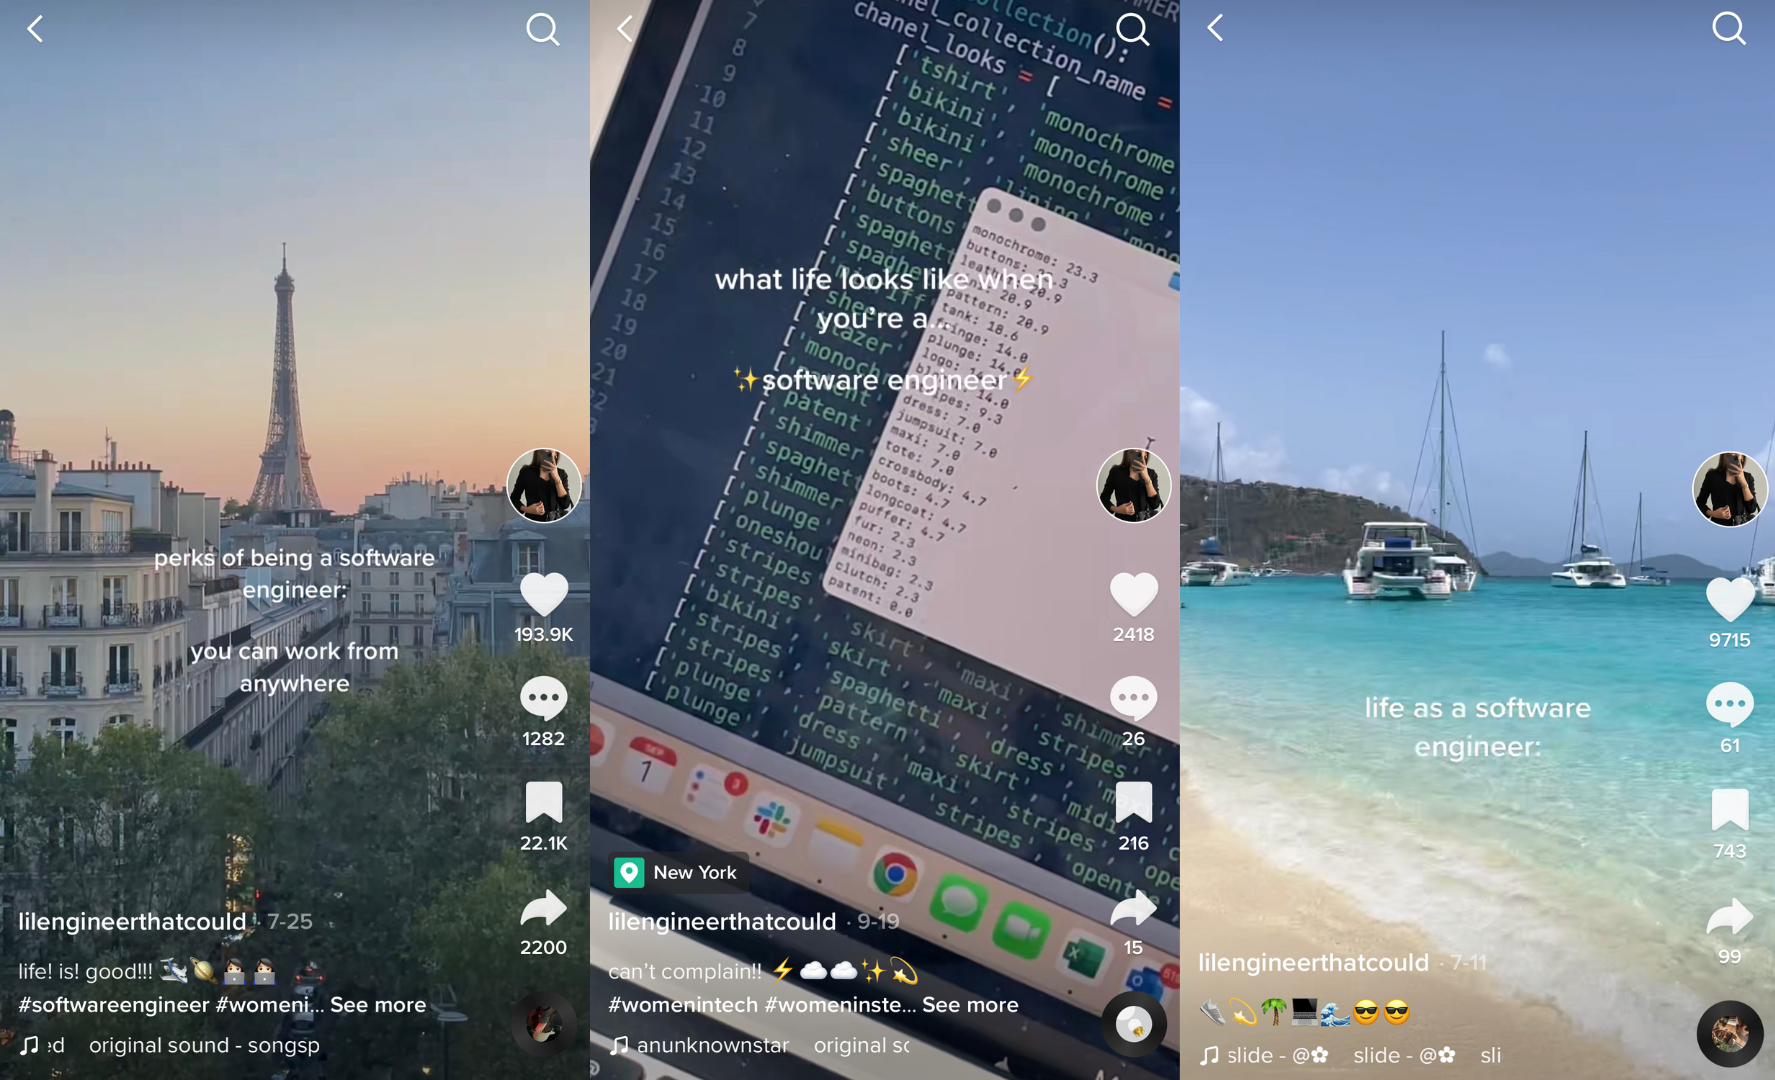
    I found Madé Lapuerta’s TikTok account (@lilengineerthatcould) a few months ago, and as a computer science major who, like many others, doesn’t necessarily want to be working in a stuffy corporate office every day glued to a monitor, I immediately became anticipatorily jealous. Her videos feature her life as a software engineer, but instead of an apartment in Silicon Valley as one would imagine, her TikToks show picturesque photographs of iced lattes in front of the Eiffel Tower, magazines and perfume bottles laid out on her desk, airplane window sunset photos, and clips of her walking around the Louvre.

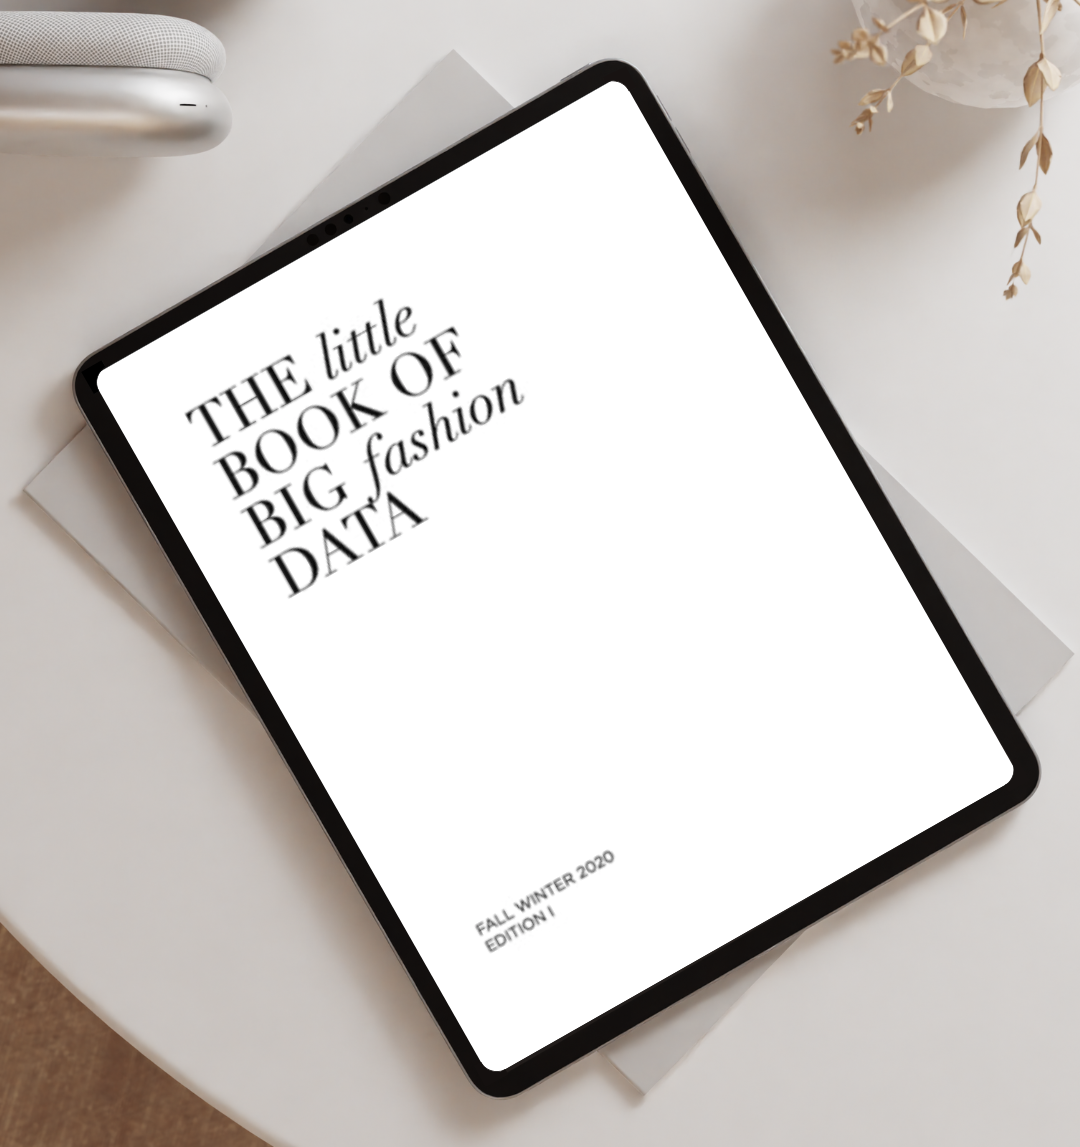
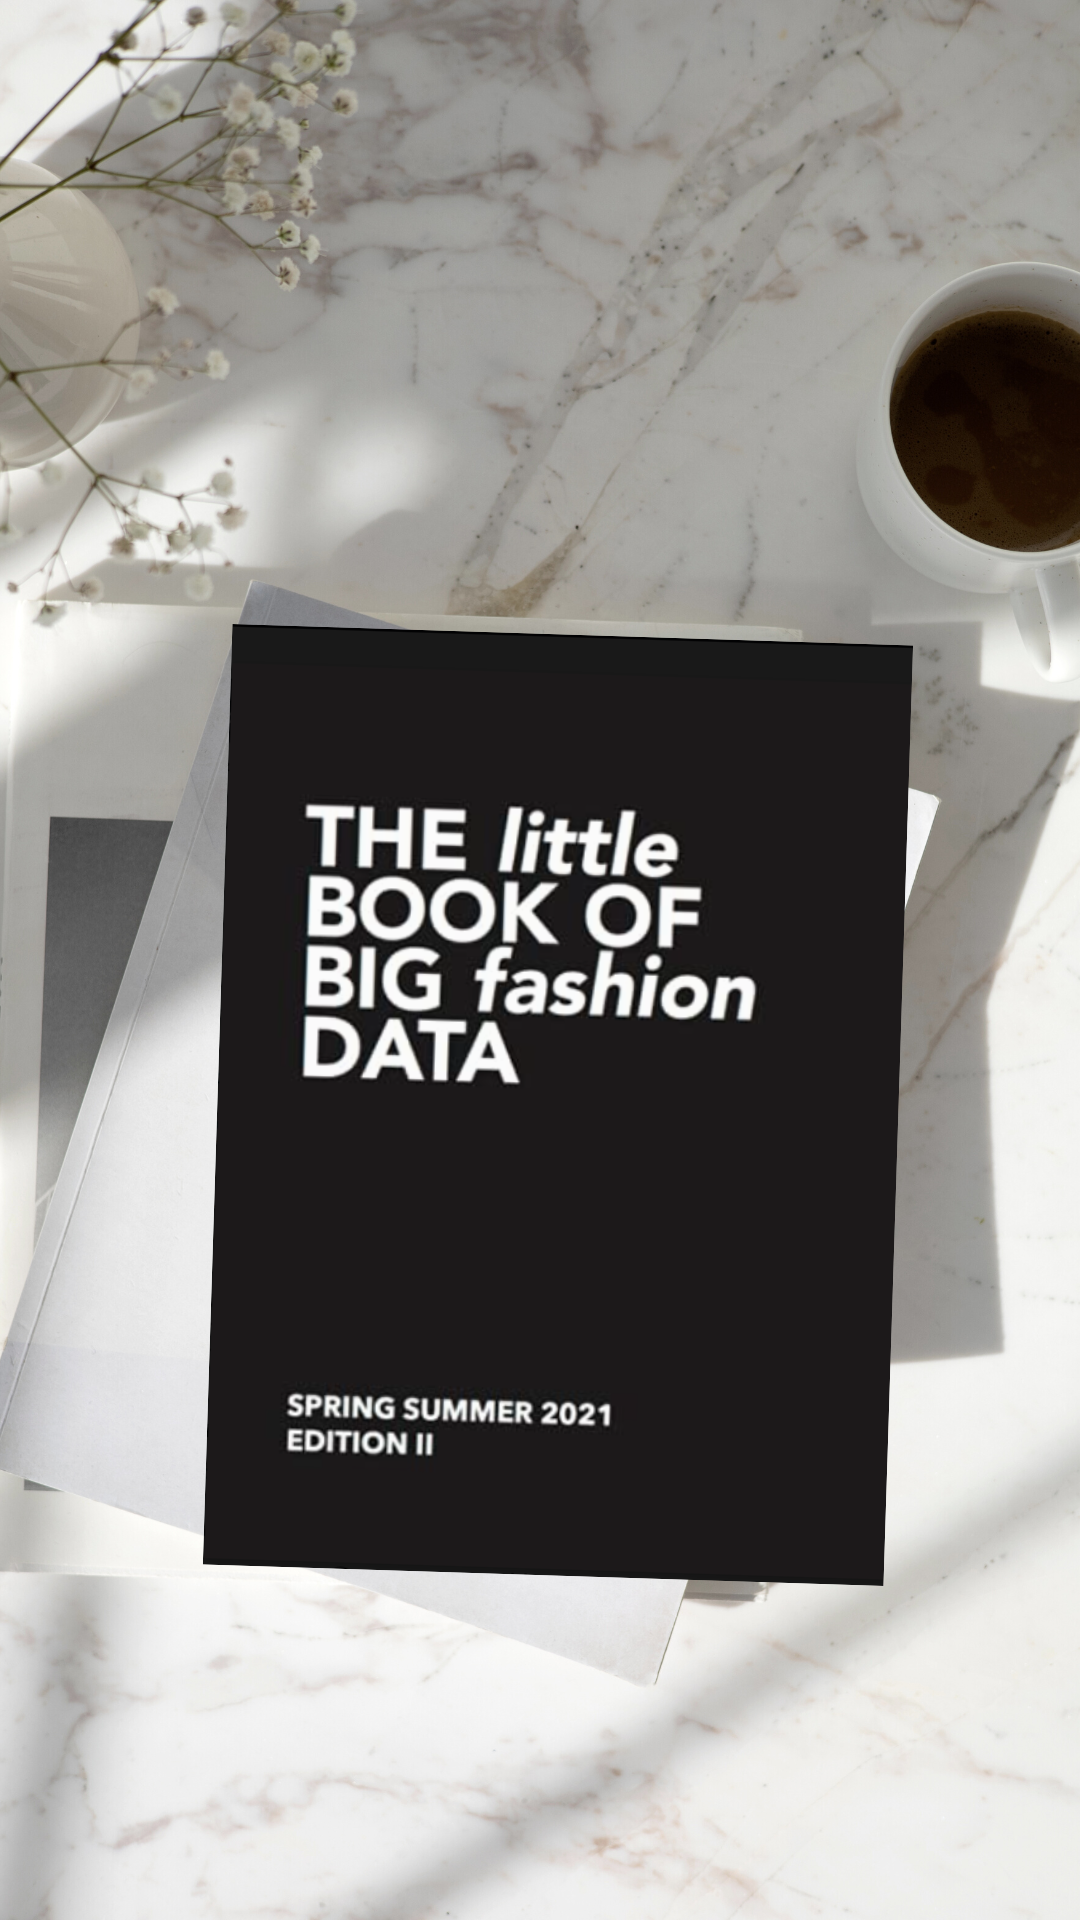
    Madé Lapuerta is a Harvard graduate, published author, and developer expanding the definition of what it means to work in software engineering and countering “tech bro” stereotypes. She wrote The Little Book of Big Fashion Data, which compiles the high-fashion trends from runway photos by using data analytics to recognize patterns in images with Python code along with Google Vision AI models. Her work fits in the intersection of fashion, machine learning, and computer vision. 

    Let’s take a second to break down those buzzwords.

    Data analytics is defined as the systematic analysis of data using computational methods – basically using computers to go through data and draw out insights such as trends, anomalies, and anything we find interesting to know. We tend to think of data as sophisticated statistics stored on our computer and in fancy data servers, but really any information is data: words written on a sheet of paper, your zip code as you type it into an online shopping form, and even cave paintings with every brushstroke. Without data analytics, all that data would stay as pure information, but to gain knowledge from the data, and interpret it so that the information becomes useful to us, we use either our brains, or recently, computers to help us! It’s estimated that in 2020, the amount of digital data that existed in the world was 59 trillion gigabytes.

    Computer vision focuses on automating computers to do the job of our eyes and brain; recognizing shapes and colors, and identifying objects. For example, in a black-and-white image made out of pixels, a computer can recognize an edge by comparing the contrast in value of pixels across a range. This might lead to the computer outlining an object as separated from the rest of the background. A computer could use photographs of fashion runway shows to recognize the clothing within the image, and identify the types of clothing the runway model wears or color palette of the outfit, which can be used in conjunction with machine learning to identify trends in hundreds or thousands of images.

    Machine learning is a subfield of artificial intelligence that is focused around building models and training algorithms to analyze data so that we don’t have to do it ourselves!. Machine learning makes data analytics faster, more accurate, and more precise. Bringing it back to fashion, some practical applications of machine learning are how retailers use it to plan what clothes to produce for each season, how much to produce, and how to price those clothes to maximize profits.

    Madé Lapuerta’s website, “Data, But Make It Fashion,” at www.fashionabledata.com gathers her findings in a cleanly designed presentation website. The home page features statistics such as “ballet flats – up 71% in popularity,“ a statement evidenced by her machine learning models, along with a link to an online shop. She writes, “I can go from a folder of hundreds of runway photos to quantifying the outfits’ colors, detecting palettes, and aggregating fashion trend insights” (Lapuerta, 2021). She also writes monthly blog posts about recent trends, surprises within them, and personal anecdotes about her experience in college and as an industry professional.

    Madé Lapuerta has quickly become a role model for me as someone in computer science with vastly contrasting interests, including art, fashion, and film. Her advice and encouragement on finding a niche within the broad field of computer science inspire me to stick with it and not be (too) worried about ending up hunched over my laptop from 9-5 every day of my professional life. Maybe I too can be the Little Software Engineer That Could.

    References:

  • POV: You are a Scientist Starting Research

    POV: You are a Scientist Starting Research

    Imagine you are sitting in your lab, racking your brain over what research project to start next. You’ve hit a metaphorical “researcher’s block” and can’t come up with anything.

    This might actually be you one day in your professional career, or even in undergraduate personal research projects. Conducting research can be fun and super interesting, however, the beginning stages of coming up with a topic can sometimes feel tedious and frustrating. Hopefully, the steps below will help introduce this process and assist in making starting your own research easier.

    1. Find a subject –> chemistry, psychology, biology, physics, etc. 
      1. Research Areas and Topics | NORC.org
    2. Look up topics in your subject and pinpoint what is interesting to you 
    3. Look up existing research articles in your topic area and hone in on a more specific problem/question that hasn’t been answered yet 
      1. Or add on to existing research (same study with new population, same study with extra/new independent variable, etc.) 
        1. The best academic research databases [2022 update] – Paperpile
          1. Research Databases | EBSCO
          2. JSTOR Home
    4. Decide on a concrete research question 
      1. Operationally define your variables 
        1. Operational Definition – defining variables based on how they will be measured (be specific) 
          1. (3) operational definition – YouTube
      2. Decide if it is plausible with your current time and resources 
      3. Is it ethical? 
        1. What Is Ethics in Research & Why Is It Important? – by David B. Resnik, J.D., Ph.D. (nih.gov)
    5. Find more articles pertaining to your research question 
      1. Background information relating to your population, independent and dependent variables, etc. 
    6. Revise your question, if needed, after looking at more research 
    7. Lay out your methodology 
      1. Will you need any scales (existing or creating one)? 
        1. Types of Data & the Scales of Measurement | UNSW Online
      2. How will you reach out to participants (if needed)? 
        1. Participant Recruitment for Research | Digital Healthcare Research (ahrq.gov)
        2. Will you need to go through the International Review Board (IRB) — necessary when using human participants!
          1. IRB Review Process | Research Ethics & Compliance (umich.edu)
      3. Will you need any advanced equipment? 
    8. What is your hypothesis? 
      1. Make it simple, logical, falsifiable, testable, and positive 
        1. Logical – founded in existing research; follows logical argument 
        2. Falsifiable – must be possible to find results contrary to the hypothesis 
        3. Testable – variables must be measurable/observable 
        4. Positive – must be positive in that it establishes the existence of something (such as a relationship, difference, etc.) 
  • Is that Marilyn Monroe… or Albert Einstein?!

    Is that Marilyn Monroe… or Albert Einstein?!

    Look at this picture from up close and far away. What changes as you move further away from the screen?

    What’s Computer Vision anyway?

    When I hear the term “computer vision”, the first thing that comes to mind is a computer with eyes that enable it to have a sense of vision. Although this is not the exact definition the computer science industry would agree with, my train of thought is on the right path. Computer vision is a subfield of computer science that concerns itself with the problem of matching up how humans see and how computers see. I know what you’re thinking- computers can’t see! That’s precisely the issue! However, after a few weeks in CS 4476 at Georgia Tech, I have begun to learn a few things about how the scientific community has worked to solve this disconnect between machines and humans. In this reflection, I will present a brief walkthrough of my experience completing CS 4476 Project 1 and some of its important concepts with corresponding pictures. If you enjoy optical illusions, get ready for hybrid images!

    There is a common misconception among people outside of the computer science (CS) community that computers are extremely smart and adept- the reason being that computers can do difficult tasks at lightning speed while a human would likely take much longer. This is FALSE! Everything a computer “knows” how to do, it was taught how by a human. Fields like artificial intelligence and machine learning have been wondering how to reflect human cognitive functions like thinking, feeling, and perceiving onto machines. Computer vision is no different- we want to know how to make a computer see the same way a human sees.

    My experience in CS and Project details

    When I started this class this semester, I was just as intimidated as I was walking into the Machine Learning course last year. I did end up surviving that terrifying ML class although I still have nightmares about the assignments. Most CS courses at Georgia Tech are known to be intimidating to me with all of the complex math and science thrown around; computer vision was no exception. The first project, titled Convolution and Hybrid Images, required students to write an image filtering function in order to create hybrid images. What does all this mean? Allow me to explain as best I can without going into intense, scary detail.

    Our project was broken up into three parts: Image Filtering, Hybrid Images with PyTorch, and understanding input/outputs in PyTorch. The first section involved using Gaussian Kernels in order to blur the images given in the prompt: to do this, we had to implement concepts from linear algebra to create vectors and statistics to manipulate variables like mean, standard deviation, and covariance of the Gaussian. The term kernel in this context does not have anything to do with popcorn, although that was my first thought too. A kernel in computer science is the core of any operating system that provides basic functions to every other part of the system.

    the visualization of the Gaussian kernel

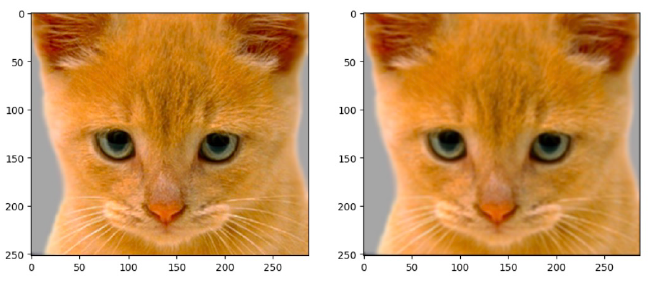
    Using the Gaussian filter, we were able to see the image filtering function we wrote in action, blurring an image of a cute cat. See how the cat on the right is ever-so-slightly blurry?

    Left-original, right-blurred

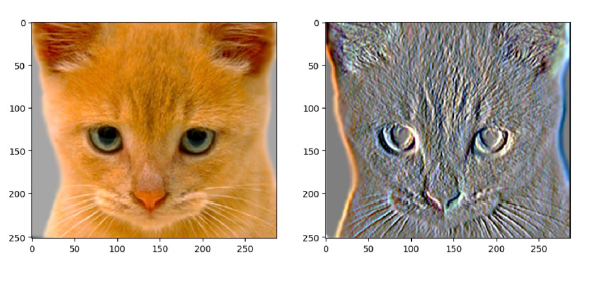
    Next, we implemented something called a Sobel Filter, which uses the Sobel operator to calculate the gradient of image intensity at each pixel. In terms of image altering, here is what happened to our cat picture after applying the Sobel Filter:

    Sobel Filter on cat image

    The real fun begins…

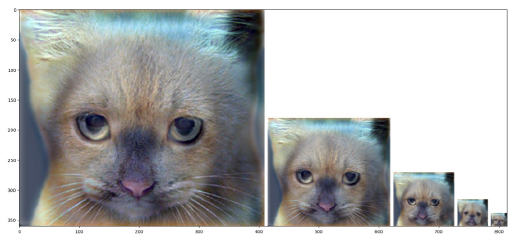
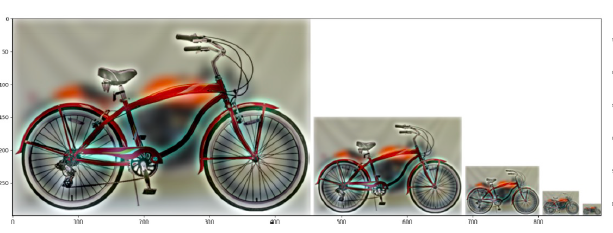
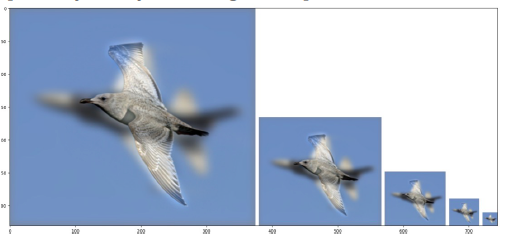
    My favorite part of this entire assignment was the hybrid image portion. A hybrid image is the combination of a low-pass filtered version of one image and a high-pass filtered version of another image. Low and high pass filtering refers to cutting out either the low or high frequencies in an image and only leaving one or the other. You might have heard about frequency in sounds, but what is frequency in an image? The frequency of an image is basically the rate of change of intensity values- if an image has high frequency, the pixels move from one pixel to the next quickly. In low frequency, the pixel’s color values share similar hues since the pixels move slowly to the next pixel. Hybrid images remind me of optical illusions because the eye sees one image from looking near the screen and sees the other image when looking from a far distance. The way that the image filtering sort of tricks the eye into seeing two different images in “one” image is one of the things that makes computer vision so cool! Some more hybrid image examples can be seen below:

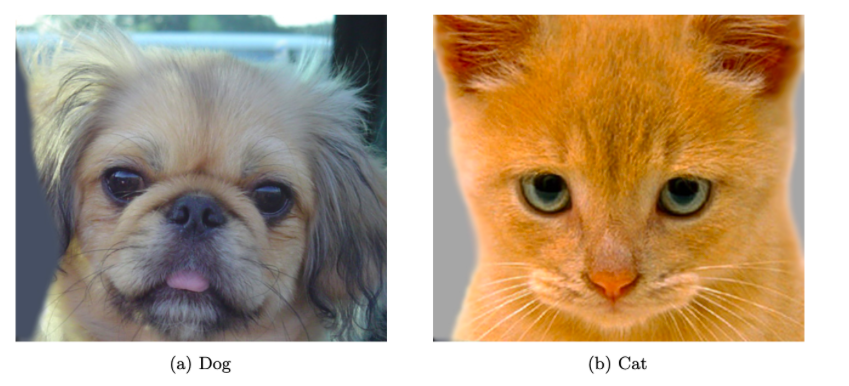
    original cat and dog images
    Cat + dog, cat from up close and dog from far away
    Motorcycle + Bicycle
    Bird + plane

    Hybrid images are created by first calculating the low frequencies of both images being used. Then we can find the high frequency of one image by subtracting its low frequency value from all the frequencies in the image. This gives us the low frequency of image 1 and the high frequency of image 2- summing these two values gives us the beautiful hybrid images seen above.

    Conclusion

    Although computer science can be daunting with its vast library of tools and functions, going through the resources bit by bit (no pun intended) and using the help of the class TAs, I was able to complete Project 1! What I learned from this project besides the actual content was that computer vision functions take a long time to run on old computers and that Piazza is one of the best tools ever utilized at Tech. Overall, I had fun making the hybrid images though it took me a while to figure out exactly how. The key to computer science is patience, asking questions, and not giving up when errors keep bombarding your terminal.

  • Sucrose V.S. Sucralose

    Sucrose V.S. Sucralose

    Sucrose vs Sucralose

    Sucrose is the sugar we use in baking, but sucralose is an artificially made sugar. Some artificial sweeteners like Splenda come from sucralose. It enhances the sweet taste of sugar, but without the added calories (heath Cleveland). Sucralose in drinks and food may seem better for you than sucrose because of the lesser calories. Low calories and higher sweetness sounds amazing, but how does sucralose affect the body in comparison to sucrose?

    Sucrose is made up of both glucose and fructose and can be found in nature. Sucrose is a carbohydrate, therefore it must break down the sucrose into smaller sugars, glucose and fructose (Libretext). From those sugars: they break down even more, get into the blood stream, and energy goes to all the cells! The body needs carbohydrates to survive because they provide calories. Sugar tastes wonderful and the body needs it, however eating a lot of sugar is not very healthy. Using calories as a measuring tool helps keep the body healthy. When eating a lot of sucrose, the body could have “higher blood pressure, inflammation, weight gain, diabetes, and fatty liver disease” (The Sweet Danger of Sugar). The body absorbs sucrose, but in excess serious side effects show.

    Sucralose provides no calories because it can’t be broken down for energy due to its manipulated structure. Of the sucrose that is ingested, 15 percent is absorbed then excreted through the urine and 85 percent goes through the digestive tract (Everything You Need to Know about Sucralose). Even though sucralose passes through the body, It still has an effect on the body.  A study published in the journal Nutrition, Obesity, and Exercise “indicated sucralose, when compared to sucrose, may increase appetite and cravings in women and those considered obese” (29). Sucralose in moderation has no side effects, but when sucralose becomes a  habit there becomes a problem. The body rejects sucralose and it has a sweeter taste, but may cause cravings. 

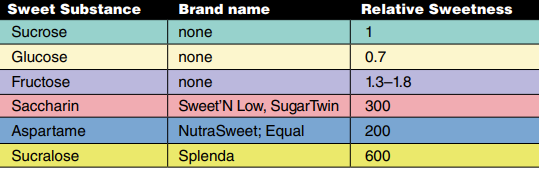
    This diagram shows more than just sucrose and sucralose’s relative sweetness. It also shows that sucralose has 600 times the relative sweetness than sucrose (Brownlee).

    Sucrose helped make sucralose and share a similar chemical structure, however they have many differences. Sucrose is a natural sugar that our body can process, but sucralose gives more of a sweet taste with less calories. The sugar sucrose in excess provides many long term issues, however sucralose in excess has minimal long term issues. To keep the body most healthy, tend towards sucrose, but sucralose in moderation is fine.


    Bibliography

    Brownlee, Christen. “The Skinny on Sweetners.” Acs, Oct. 2011, https://www.acs.org/content/dam/acsorg/education/resources/highschool/chemmatters/archive/chemmatters-oct2007-percyjulian-brownlee.pdf. 

    “Everything You Need to Know about Sucralose.” Food Insight, 10 Feb. 2022, https://foodinsight.org/everything-you-need-to-know-about-sucralose/.

    Libretexts. “3.3: Digestion and Absorption of Carbohydrates.” Medicine LibreTexts, Libretexts, 14 Aug. 2020, https://med.libretexts.org/Courses/American_Public_University/APUS%3A_An_Introduction_to_Nutrition_(Byerley)/APUS%3A_An_Introduction_to_Nutrition_1st_Edition/03%3A_Carbohydrates/3.03%3A_Digestion_and_Absorption_of_Carbohydrates#:~:text=Carbohydrates%20are%20not%20chemically%20broken,and%20delivered%20to%20the%20liver.

    “The Sweet Danger of Sugar.” Harvard Health, Harvard Health Publishing, 6 Jan. 2022, https://www.health.harvard.edu/heart-health/the-sweet-danger-of-sugar#:~:text=%22The%20effects%20of%20added%20sugar,Hu.

    29, Alex Smolokoff | Sep. “Artificial Sweetener Linked to Increased Appetite, Cravings.” Food Beverage Insider, 29 Sept. 2021, https://www.foodbeverageinsider.com/sweeteners/artificial-sweetener-linked-increased-appetite-cravings. 
  • Wildlife around campus

    Wildlife around campus

    The following pictures were all taken at Georgia Tech on May 4th. They capture only a tiny portion of the wildlife on campus.

    Northern mockingbird behind Love
    Land snail behind Fulmer
    Eastern towhee behind Boggs
    Roly-poly behind Fulmer
    Possum behind parking lot by GTRI – look at those little teefies!!
    Brown thrasher (state bird of Georgia) behind Love
    Gray squirrel between Clough and Architecture
    Gray catbirds by MRDC
    Red morph gray squirrel behind Love
    Juvenile red-shouldered hawk with a worm snake lunch