Category: Articles

  • Can diapers improve agricultural management?

    Can diapers improve agricultural management?

         Ever wondered how diapers can hold and absorb so much liquid?  The simple answer is hydrogels.  Disposable diapers have been on the rise in popularity in recent years because of their ease of use.  Unfortunately with the sudden increase in popularity of diapers,  waste management is a big issue all around the world.  Everyone is trying to find new and innovative ways to decrease the generation of waste.  Because of the short life span of disposable diapers, they end up in a waste field which causes very serious environmental impacts. Consequently, people are switching over to reusable diapers.  While this is, in fact, a positive, the much bigger issue is in developing countries where the majority of disposable diapers are being used.  In many of these developing countries, the used diapers are disposed of in either landfills or open dumpsites.  The mismanagement of solid waste can lead to an increase in greenhouse gas emissions and water pollution from the open dumpsites.  These hydrogels after being sanitized might have the possibility to be reused or repurposed for another product.   Current research focuses on the reuse of hydrogels for soil irrigation.  

         A hydrogel is a chemically or physically bonded polymer.  Chemically bonded hydrogels are permanent and chemically cross-linked together.  Physically bonded hydrogels are reversible and are held together by hydrogen bonding from its interactions with water.  The only difference between chemically and physically bonded hydrogel is that physically bonded hydrogels can be separated into individual components.   How much water a hydrogel can hold is the point of equilibrium swelling which is the most important characteristic.  When a hydrogel connects with water, the hydrophobic groups interact with the water molecules. The hydrophobic group tends to repel water, which leads to the swelling of the hydrogel.  As the hydrogel swells, it is absorbing the surrendering water until it reaches its equilibrium swelling point.  Every hydrogel has its own equilibrium swelling point.  Once it reaches this point it will not swell anymore and the additional water will fill in the spaces between the bonds. 

          Traditionally, agricultural methods are based on irrigation methods such as drip and spray and, flood irrigation.  This has some downfalls because not all the water is absorbed by the plants which can lead to runoff water.  In some countries, this poses a bigger threat because of the scarcity of water.  Sandy soils are impacted at a greater extent because they have low water carrying capacity which makes it hard for them to absorb water.  This leads to most of the water being unabsorbed and the plant roots lacking sufficient water and nutrients.  Since hydrogels are very absorptive,  they can be used to absorb some of the excess water so the water does not go to waste. 

         Hydrogels can be used to improve agricultural management.  Many studies are looking into if the hydrogels in diapers can be reused and repurposed after sanitation, but still, maintain the level of equilibrium swelling and have the ability to hold the water for a long period of time. Luckily, they were proven to have a larger equilibrium swelling capacity and a longer swell time.  These two factors can greatly improve water retention in soil and irrigation efficiency.  Because of the basic properties of a hydrogel, they are allowed to slowly release the water back into the soil, this allows improved water efficiency.  This is because the plant’s roots are not drowning in large amounts of water which makes it harder for them to retain all of it.  While the hydrogel is in the soil, it will wrap around the roots and will continue to give the roots the water supply it needs for photosynthesis.  There still is a long way to go on researching this idea, but maybe in the future, we will be able to reuse hydrogels and many other everyday items.  

    Citations 

    Agaba, H., Orikiriza, L., Obua, J., Kabasa, J., Worbes, M., & Hüttermann, A. (2011, November 17). Hydrogel amendment to sandy soil reduces irrigation frequency and improves the biomass of Agrostis stolonifera. Retrieved November 24, 2020, from https://www.scirp.org/journal/PaperInformation.aspx?PaperID=8549

    Al-Jabari, M., Ghyadah, R., & Alokely, R. (2019, March 20). Recovery of hydrogel from baby diaper wastes and its application for enhancing soil irrigation management. Retrieved November 23, 2020, from https://www.sciencedirect.com/science/article/pii/S0301479719303901

    Ferronato, N., Nova Pinedo, M., & Torretta, V. (2020, June 21). Assessment of Used Baby Diapers Composting in Bolivia. Retrieved November 24, 2020, from https://www.mdpi.com/2071-1050/12/12/5055

    Zekry, M., Abdallah, A., Salim, H., & Nassar, I. (2020, March 07). The Potential of super absorbent polymers from diaper wastes to enhance water retention properties of the soil. Retrieved November 24, 2020, from https://www.researchgate.net/publication/341756185_The_Potential_of_super_absorbent_polymers_from_diaper_wastes_to_enhance_water_retention_properties_of_the_soil

     

  • Insect robots: How do they fly?

    Insect robots: How do they fly?


    “How do airplanes stay afloat?”

    “The same way a bird stays afloat.”

    When we give that answer to a kid, we fondly realize the connection between nature’s creatures and machines, and that the nature influenced creation of many machines from time to time. That is why the Wright brothers spent a great deal of time observing birds in flight and realized that when birds soared into the wind, the air flowed over the curved surface of their wings, and thus generated lift which helps them stay in flight. They noticed the wings of birds minutely, and realized that they change the shape of the wings to turn and maneuver, and thus flaps and stabilizers were born in the airplane wings. In a similar fashion, various insects and birds have influenced designs of many machines for their structural and aerodynamic ability. These creatures not only helped design the structural and aerodynamic systems of large machines, but attracted considerable attention from scientists and engineers for small-scale robots. Today we deep dive into the world of small robots and how they fly!

    Insects were the first organisms on Earth to take to the skies – estimates on the origin of insect flight range from ~320 to ~400 million years ago (Misof et al., 2014). That is a long, long time before vertebrates achieved this feat. Over time, insects mastered their flying ability, and achieved great perfection in speed, agility, and grace in the air. By design, insects such as hover flies and birds such as hummingbird have remarkable abilities to hover in the air, as well as being able to perform aerobatic maneuvers such as sideways or backward flying. The technique that they use is called a flapping wing motion. This remarkable ability is a key in the design of small-scale aircraft for surveillance or reconnaissance. Traditionally, engineers designed a medium to large scale aerodynamic vehicle with traditional mechanical linkage systems (Van Breugel et al., 2008). However, when it comes to an unmanned small-scale aerial vehicle (or even micro-scale that mimics the size of an actual small insect such as a hover fly), one of the key challenges in traditional designs was that the flapping-wing action was not stable because of the power and weight ratio that needs to be achieved to match the hovering and flying abilities of the insects and birds observed in nature.

    Historically, there have been a number of research efforts that focused on the mechanical and structural aspects of a small-scale flying robot design. One such project was the Entomopter project in Georgia Tech (Michelson et al., 1998). The researchers used a chemical muscle to produce linear actuation strain. Two sets of rigid wings (front and back) were placed, and chemical muscle actuated them. Other traditional designs of small-scale flying robots used gears and links for the movements needed for of an airborne vehicle.

    How do the “insect” robots get up in the air?

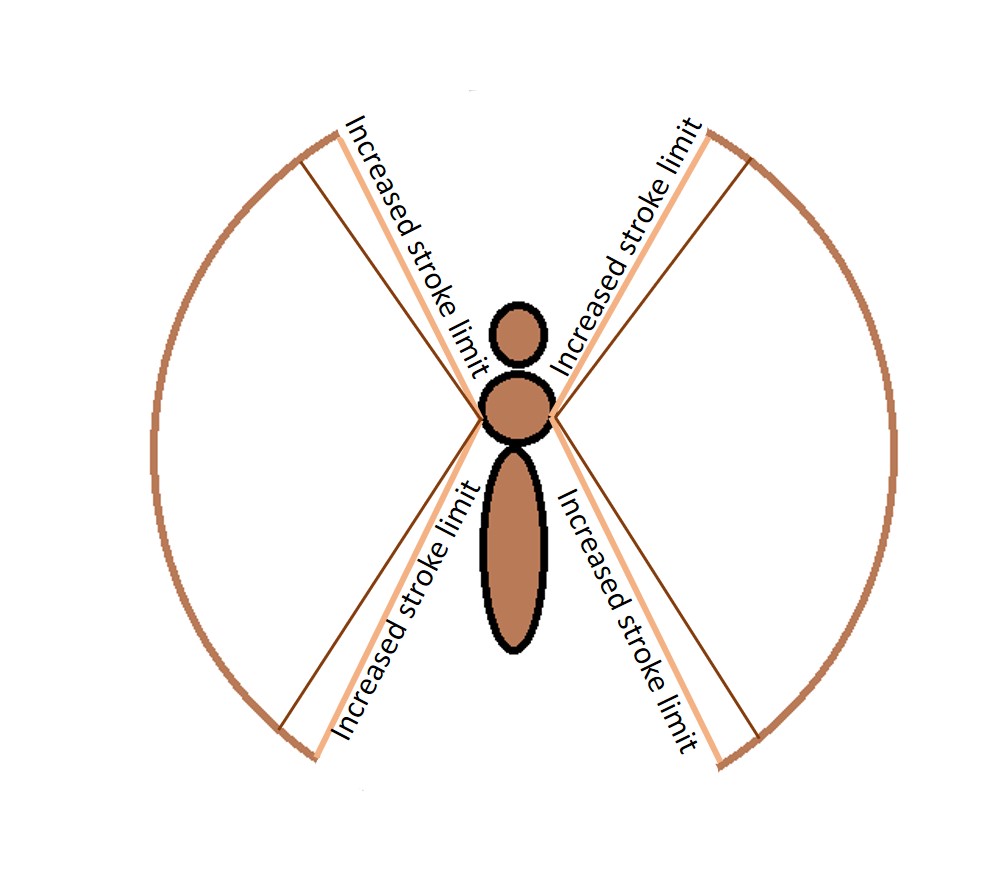
    In order to achieve a flapping action in-flight to gain altitude, sweeping and the pitching motions are needed to be achieved. The current design is set up to exploit resonant properties, as exhibited by flying insects, to reduce the energy expenditure and to provide amplitude amplification for the wing sweeping motion (Bolsman, 2010). Design objective for a small-scale flying machine is to reproduce a reference motion based on the kinematics of insects. Insects and birds perform wing flapping and adjustments of the body orientation in order to control speed, altitude and orientation of the flight. As shown in the figure below, to transfer this analogy to a micro-robot, the sweeping motion of the wings are emulated as a steady-state motion. The details of a control system can be found in advance literature (Bolsman, 2010). However, in simple terms, the design takes into account a constant resonance frequency, and a maximum wind sweeping stroke. As the stroke increases (shown by the extreme lines in the figure), the wings generate lift. The mass of the device (as in an insect) is centered towards the geometric center of the device, resulting in maximum possible stability. This is the stage where the robots get airborne and continue hovering.

    Lift: Flapping wing motion with sweeping stroke

    How do the “insect” robots move in the air?

    The hovering is the first state of condition that the robots achieve, similar to an insect. The figure above shows a simple two wing device. Each wing is designed to have independent controls to change flapping In order to change the direction to left or right, so that each wing is capable of having a different sweeping motion. This inevitably creates a sweeping motion that are not equal in each wing, and results in a rotation in the direction of the difference. An insect performs these exact same maneuvers to create a rotational motion for left-right (rolling) movement.

    As shown in the figure, the center position holds the center of mass for the whole assembly. As such, changing the center position of the sweeping motion will change the direction of flight as well. This is performed by shifting the positions of the effective centers of pressure of the left and right wings. This invariably creates a backward motion (or pitch), and more power from the device’s power source provides a required forward motion while maintaining the achieved altitude.

    How strong are these “insect” robots?

    A simple model of a small-scale flying robot has been described here to depict the fundamentals that are derived from an insect or a small bird for flapping motion design. A fully fledged flying micro robot has more control systems that are able to achieve a full range of motions if needed, with more complicated actuations that are associated with multiple wings and wing rotations. In addition, structural integrity is also a key factor which, surprisingly, is also derived from insects. One of the most fascinating and extraordinary creatures in earth are ants, they can carry objects several times of their body weight. Ant’s neck has a very sturdy construction by nature, because of the fact that they lift the large weights with their mouth, and the load is transferred through the neck. Researchers found from models that an ant’s neck can withstand loads of about 5,000 times the ant’s body weight! (Nguyen, 2012). This design is also simulated to be able to provide the micro robots a sturdy yet very lightweight construction, a critical requirement for such a device.

    Ultra-light, small scale robots are in use for surveillance, military operations, rescue missions, medical sector, hazardous material test/retrieval, and many other scenarios. We will continue to see the marvelous development of these micro machines, inspired by the insects and small birds around us, while pondering over the question: “how birds fly?”

    References:

    1. Bolsman, C. T. (2010). Flapping wing actuation using resonant compliant mechanisms: An insect-inspired design.
    2. Van Breugel, F., Regan, W., & Lipson, H. (2008). From insects to machines. IEEE robotics & automation magazine, 15(4), 68-74.
    3. Misof, B., Liu, S., Meusemann, K., Peters, R. S., Donath, A., Mayer, C., … & Niehuis, O. (2014). Phylogenomics resolves the timing and pattern of insect evolution. Science, 346(6210), 763-767.
    4. Michelson, R. C. (2000). S. Patent No. 6,082,671. Washington, DC: U.S. Patent and Trademark Office.
    5. Michelson, R. C., & Reece, S. (1998, March). Update on flapping wing micro air vehicle research-ongoing work to develop a flapping wing, crawling entomopter. In 13th Bristol International RPV/UAV Systems Conference Proceedings, Bristol England(Vol. 30, pp. 30-1).
    6. Nguyen, V. N. (2012). Development of a Finite Element Model of an Ant Neck Joint for Simulation of Tensile Loading(Doctoral dissertation, The Ohio State University).
  • The Undersea Bone Devourer

    The Undersea Bone Devourer

    Osedax, from the Latin os, oris (bone) and edāx, edācis (devourer), is a genus of undersea worms that consumes bone. A genus (which is more Latin, this time for a family group) is a group of species that are similar. More distantly, the genus Osedax belongs to the family Siboglinidae. Siboglinidae is a family (a level above in the biological categorization hierarchy from genus) composed of segmented worms, all of which have chitin bristles. Chitin is a natural substance that is found in all sorts of bugs, and it’s similar to the material that makes up your fingernails. Another prominent species in this family are the undersea tubal worms that live at the hydrothermal vents at the bottom of the ocean. It turns out there is a surprising amount of diversity of species of undersea bone eating worms. The worms range in size and in behavior. You can find members of the Osedax genus in all seven oceans, and in all sorts of depths (21 – 4000 m). Some of them are generalists, whereas others specialize in large bone deposits often found on the ocean floor. Whalefalls (you can read more about them here: https://2026fat.chargedmag.org/2012/06/whale-fall-2/) are one such source of large bone deposits on the ocean floor.

    Osedax worms were first discovered in 1994. Biologists were initially baffled at what exactly they were. The worms evaded classification until molecular DNA analysis showed that they were related to the tube worms that live in hydrothermal vents on the ocean floor. This breakthrough allowed biologists to finally place the Osedax genus into the Siboglinidae family. Later, fossils were discovered of Osedax worms inhabiting a large, dead reptile, dated to the early-Late Cretaceous period, about 100 million years ago. This led to several revelations about the history of Osedax worms. Firstly, there was now a historical precedent for being generalists, rather than whale specialists. Osedax worms were initially discovered and identified on whale falls, and there was some debate in the scientific community about whether or not they occupied other niches. Well, giant dead reptiles certainly weren’t whales, so this find cleared that up nicely. The fossil finding also illustrates something about the history of Osedax worms and the Siboglinidae family. This finding confirmed an earlier theory that the Siboglinidae family originated somewhere in the mid-Cretaceous period. It also means that the weird bone eating worms under the sea outlasted the dinosaurs, which is neat.

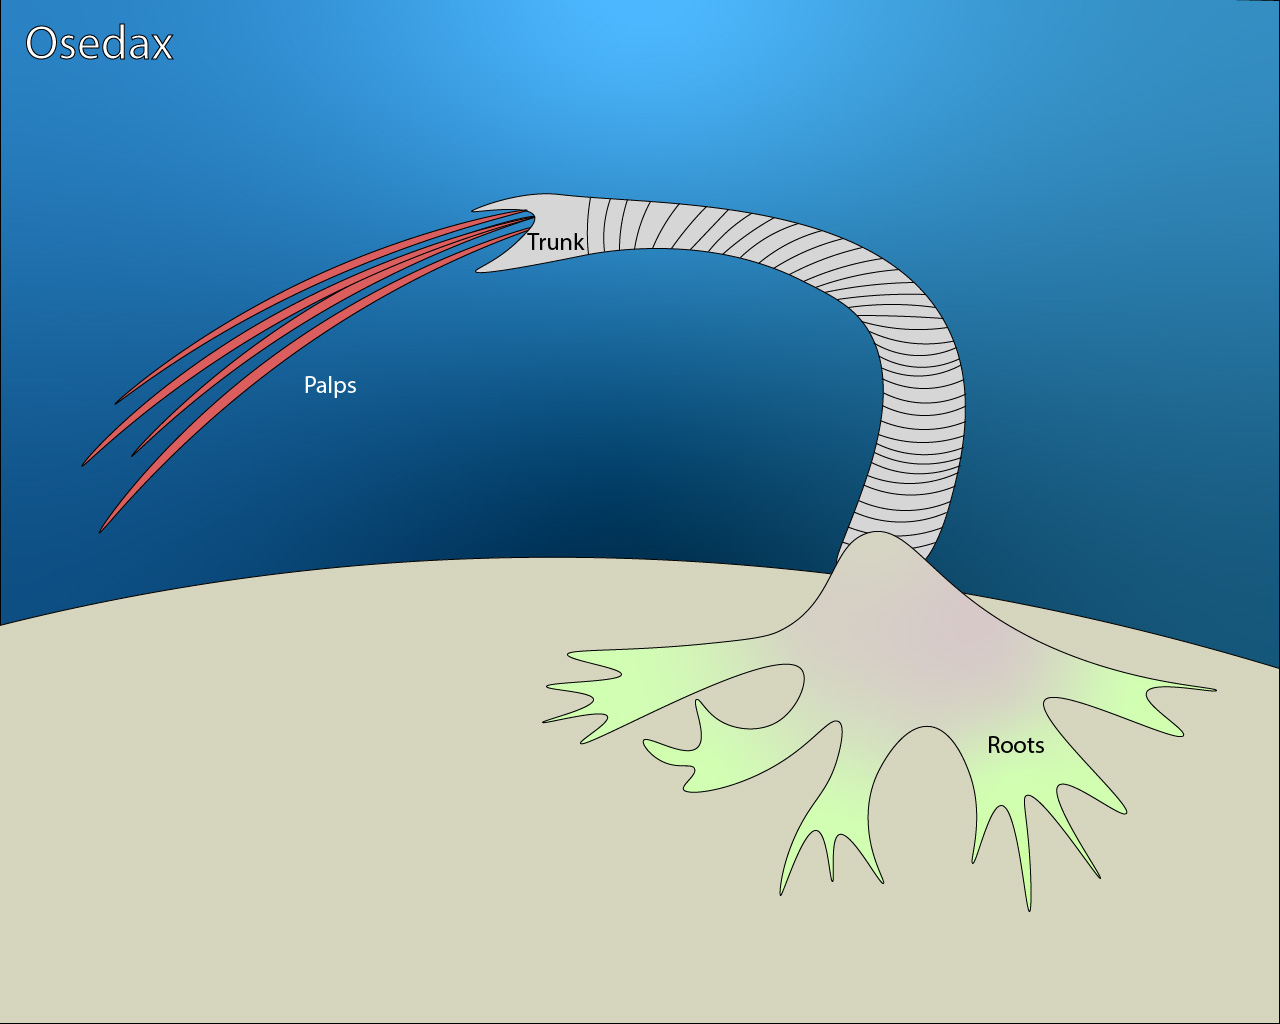
    A labeled illustration of an Osedax worm.
    A labeled illustration of an Osedax worm.

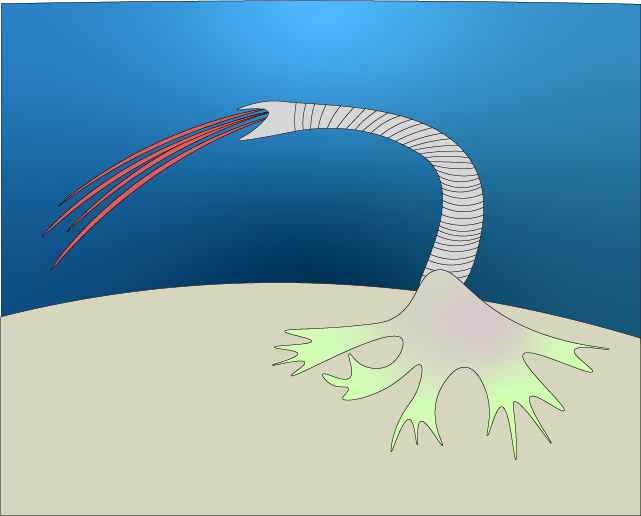
    Physically, Osedax worms are strange looking creatures. Red, string-looking bits float out from one side of the main worm body. On the other side, there are green, root-like structures sticking out back. These roots secrete acids to dissolve the bones where they lodge. Their middle is a white, segmented tube. It doesn’t get any more regular on the inside, either. Osedax worms don’t have a digestive system – they just host a wealth of bacteria inside of them to digest the bones they consume. Another strange thing about the inside of an Osedax worm is that the male worms live inside the females. As in, every picture of an Osedax worm you see will be of a female, as the males are teeny tiny and live inside of the females. Dwarf males, as this phenomenon is called, occurs when the males of a species are much smaller (and usually simpler anatomically) than the females. In species where dwarf males exist, the males typically reside somewhere inside or attached to the female members of the species. Osedax worms are at least as odd as you were expecting worms that ate bones to be, at very least.


    References

    • Smith, Craig R, Glover, Adrian G, Treude, Tina, Higgs, Nicholas D, & Amon, Diva J. (2015). Whale-Fall Ecosystems: Recent Insights into Ecology, Paleoecology, and Evolution. Annual Review of Marine Science, 7(1), 571-596.
    • Rouse, G. W. (2004). Osedax: Bone-Eating Marine Worms with Dwarf Males. Science (American Association for the Advancement of Science), 305(5684), 668-671.
    • Danise, S, & Higgs, N. D. (2015). Bone-eating Osedax worms lived on Mesozoic marine reptile deadfalls. Biology Letters (2005), 11(4), 20150072.
  • The Chemistry Behind Common Workout Supplements

    The Chemistry Behind Common Workout Supplements

    In the fitness community, novice and expert athletes alike, are continually searching for supplements that will give an athletic edge in their workouts. There are many athletes, especially newer and younger ones, that are ingesting supplements without actually understanding what the supplements are doing to their bodies. Since workout supplements are not regulated by the US FDA, manufacturers are able to put whatever they want into their supplements – even ingredients that toe the line between legal and illegal, including some ingredients that are amphetamine derivatives. These manufacturers hide these ingredients in what they call “proprietary blends”. So that you can be informed, here are the three most common and generally accepted to be safe workout supplements:

    1)    Creatine

    2)    Caffeine

    3)    Beta-Alanine

    Additionally, these are two ingredients in popular supplements today that you should NOT be taking:

    1)    DMAA

    2)    DMHA

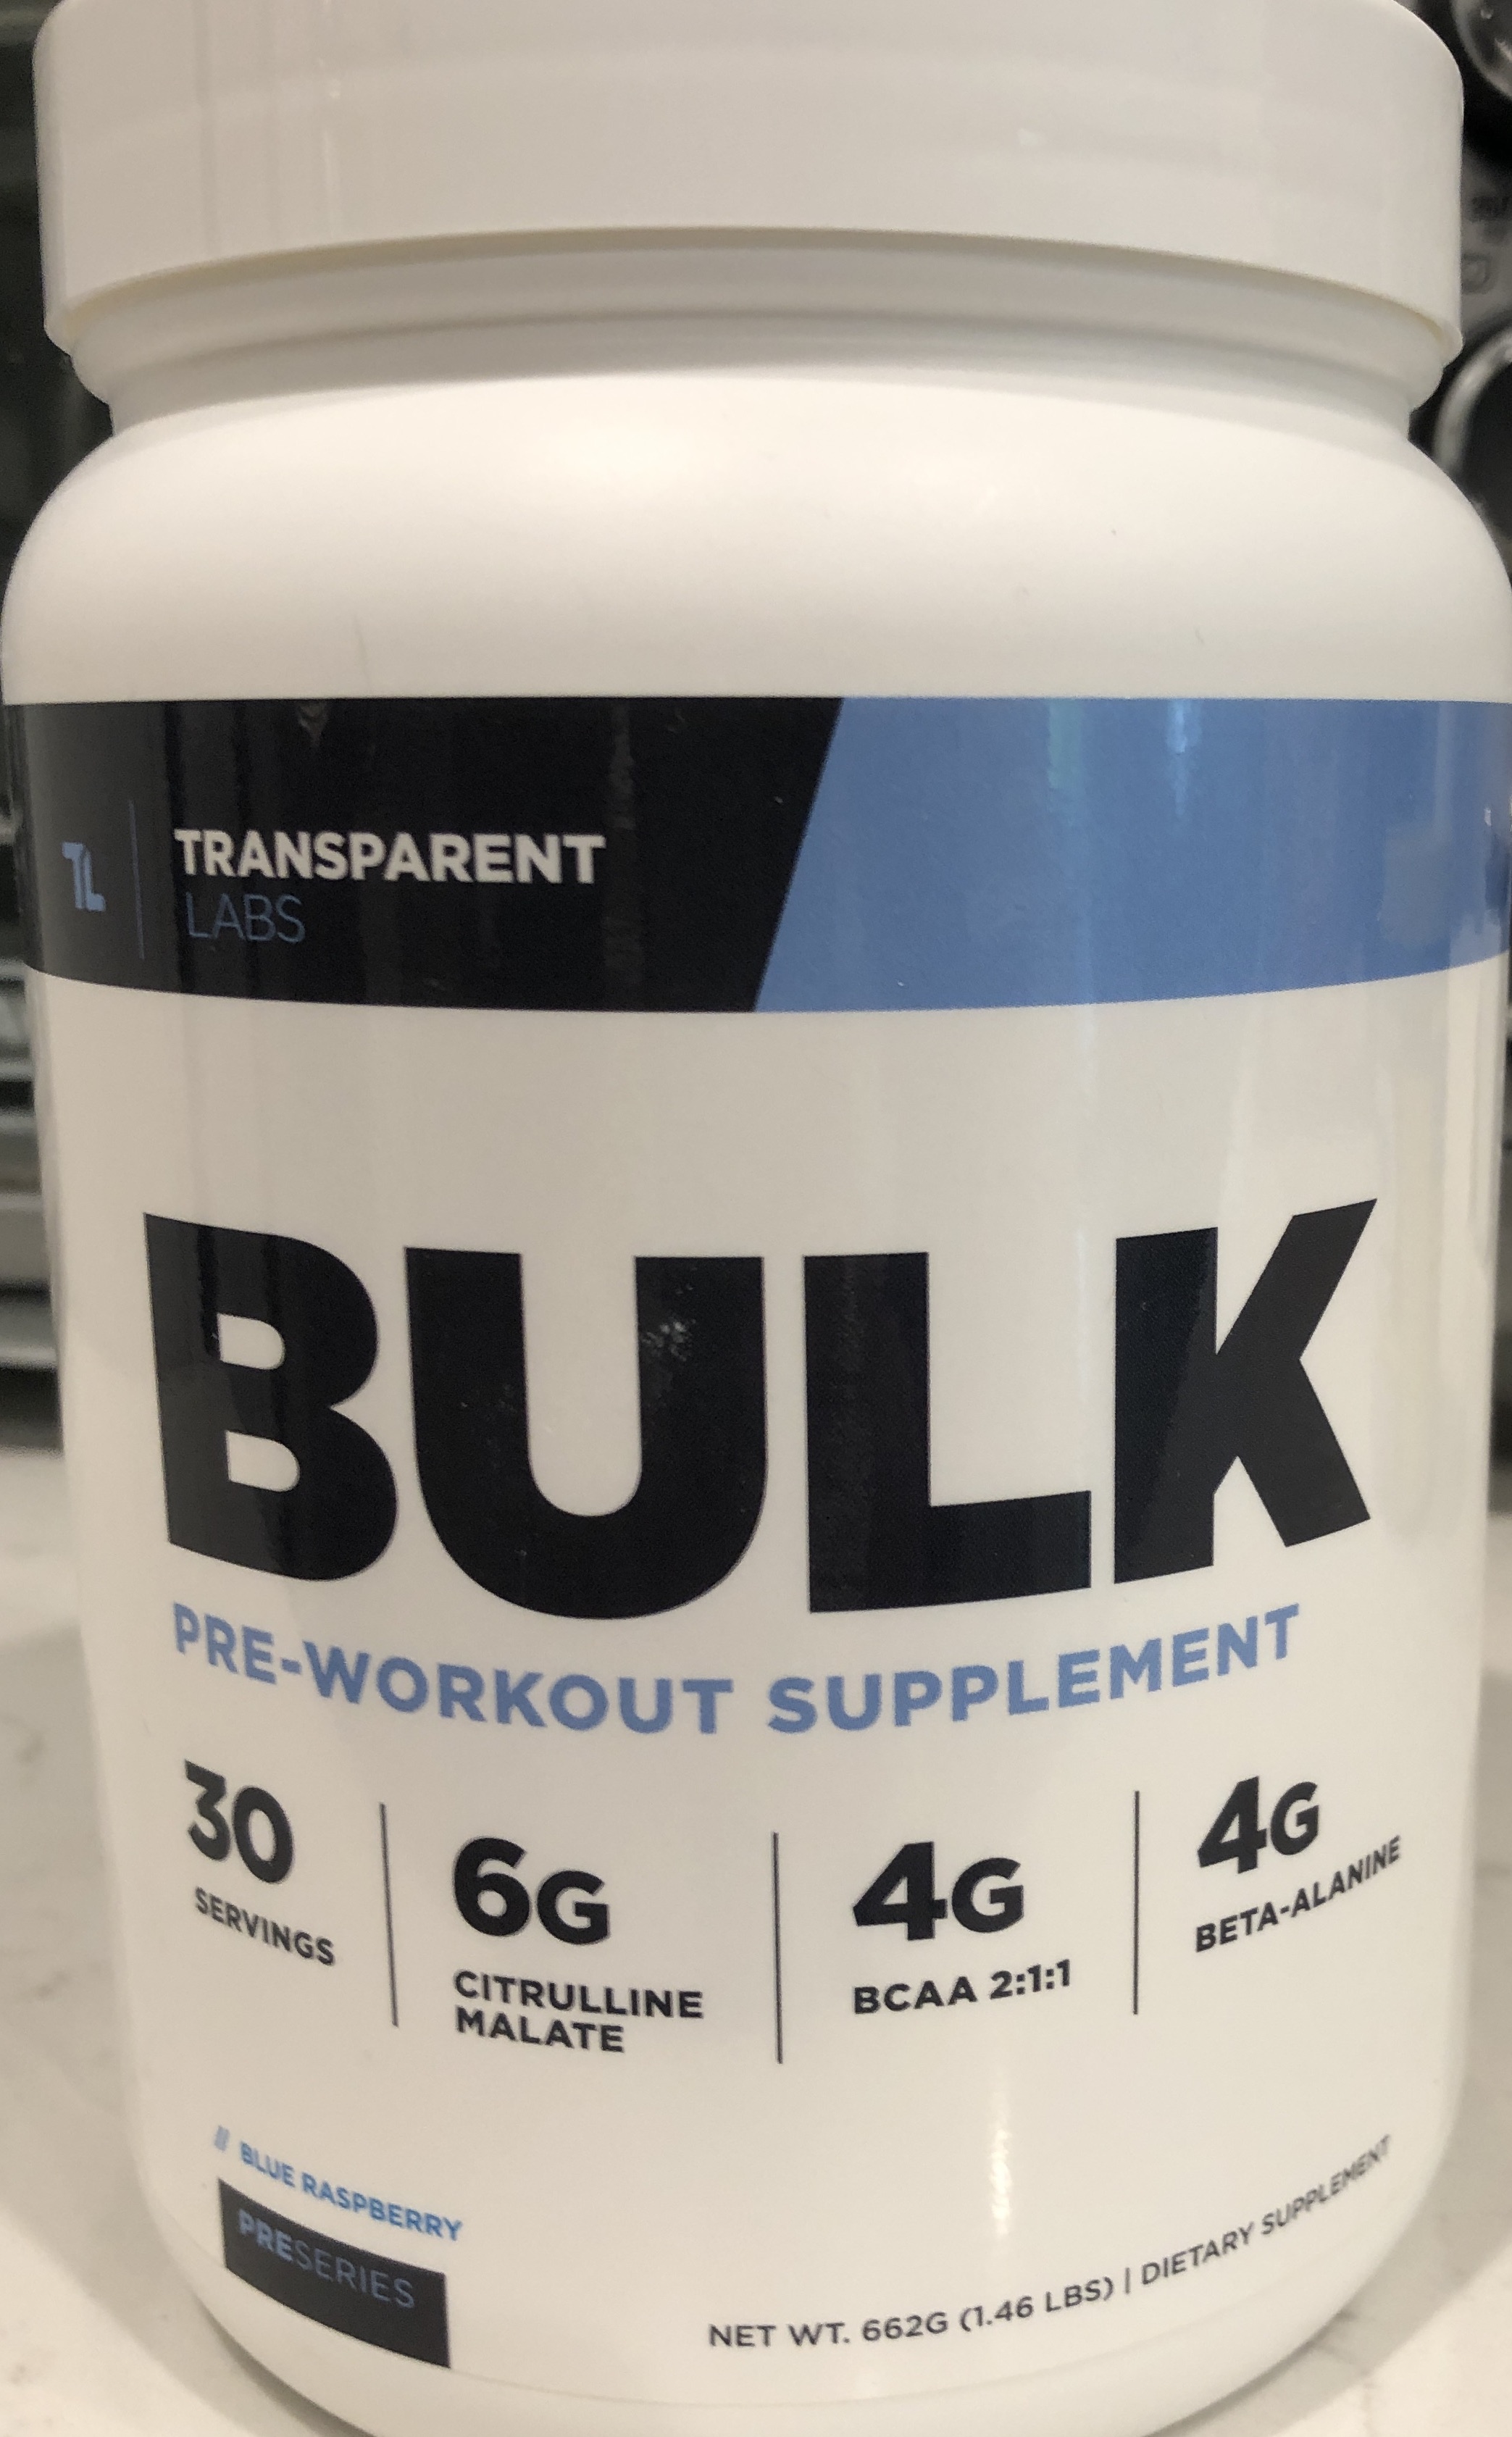
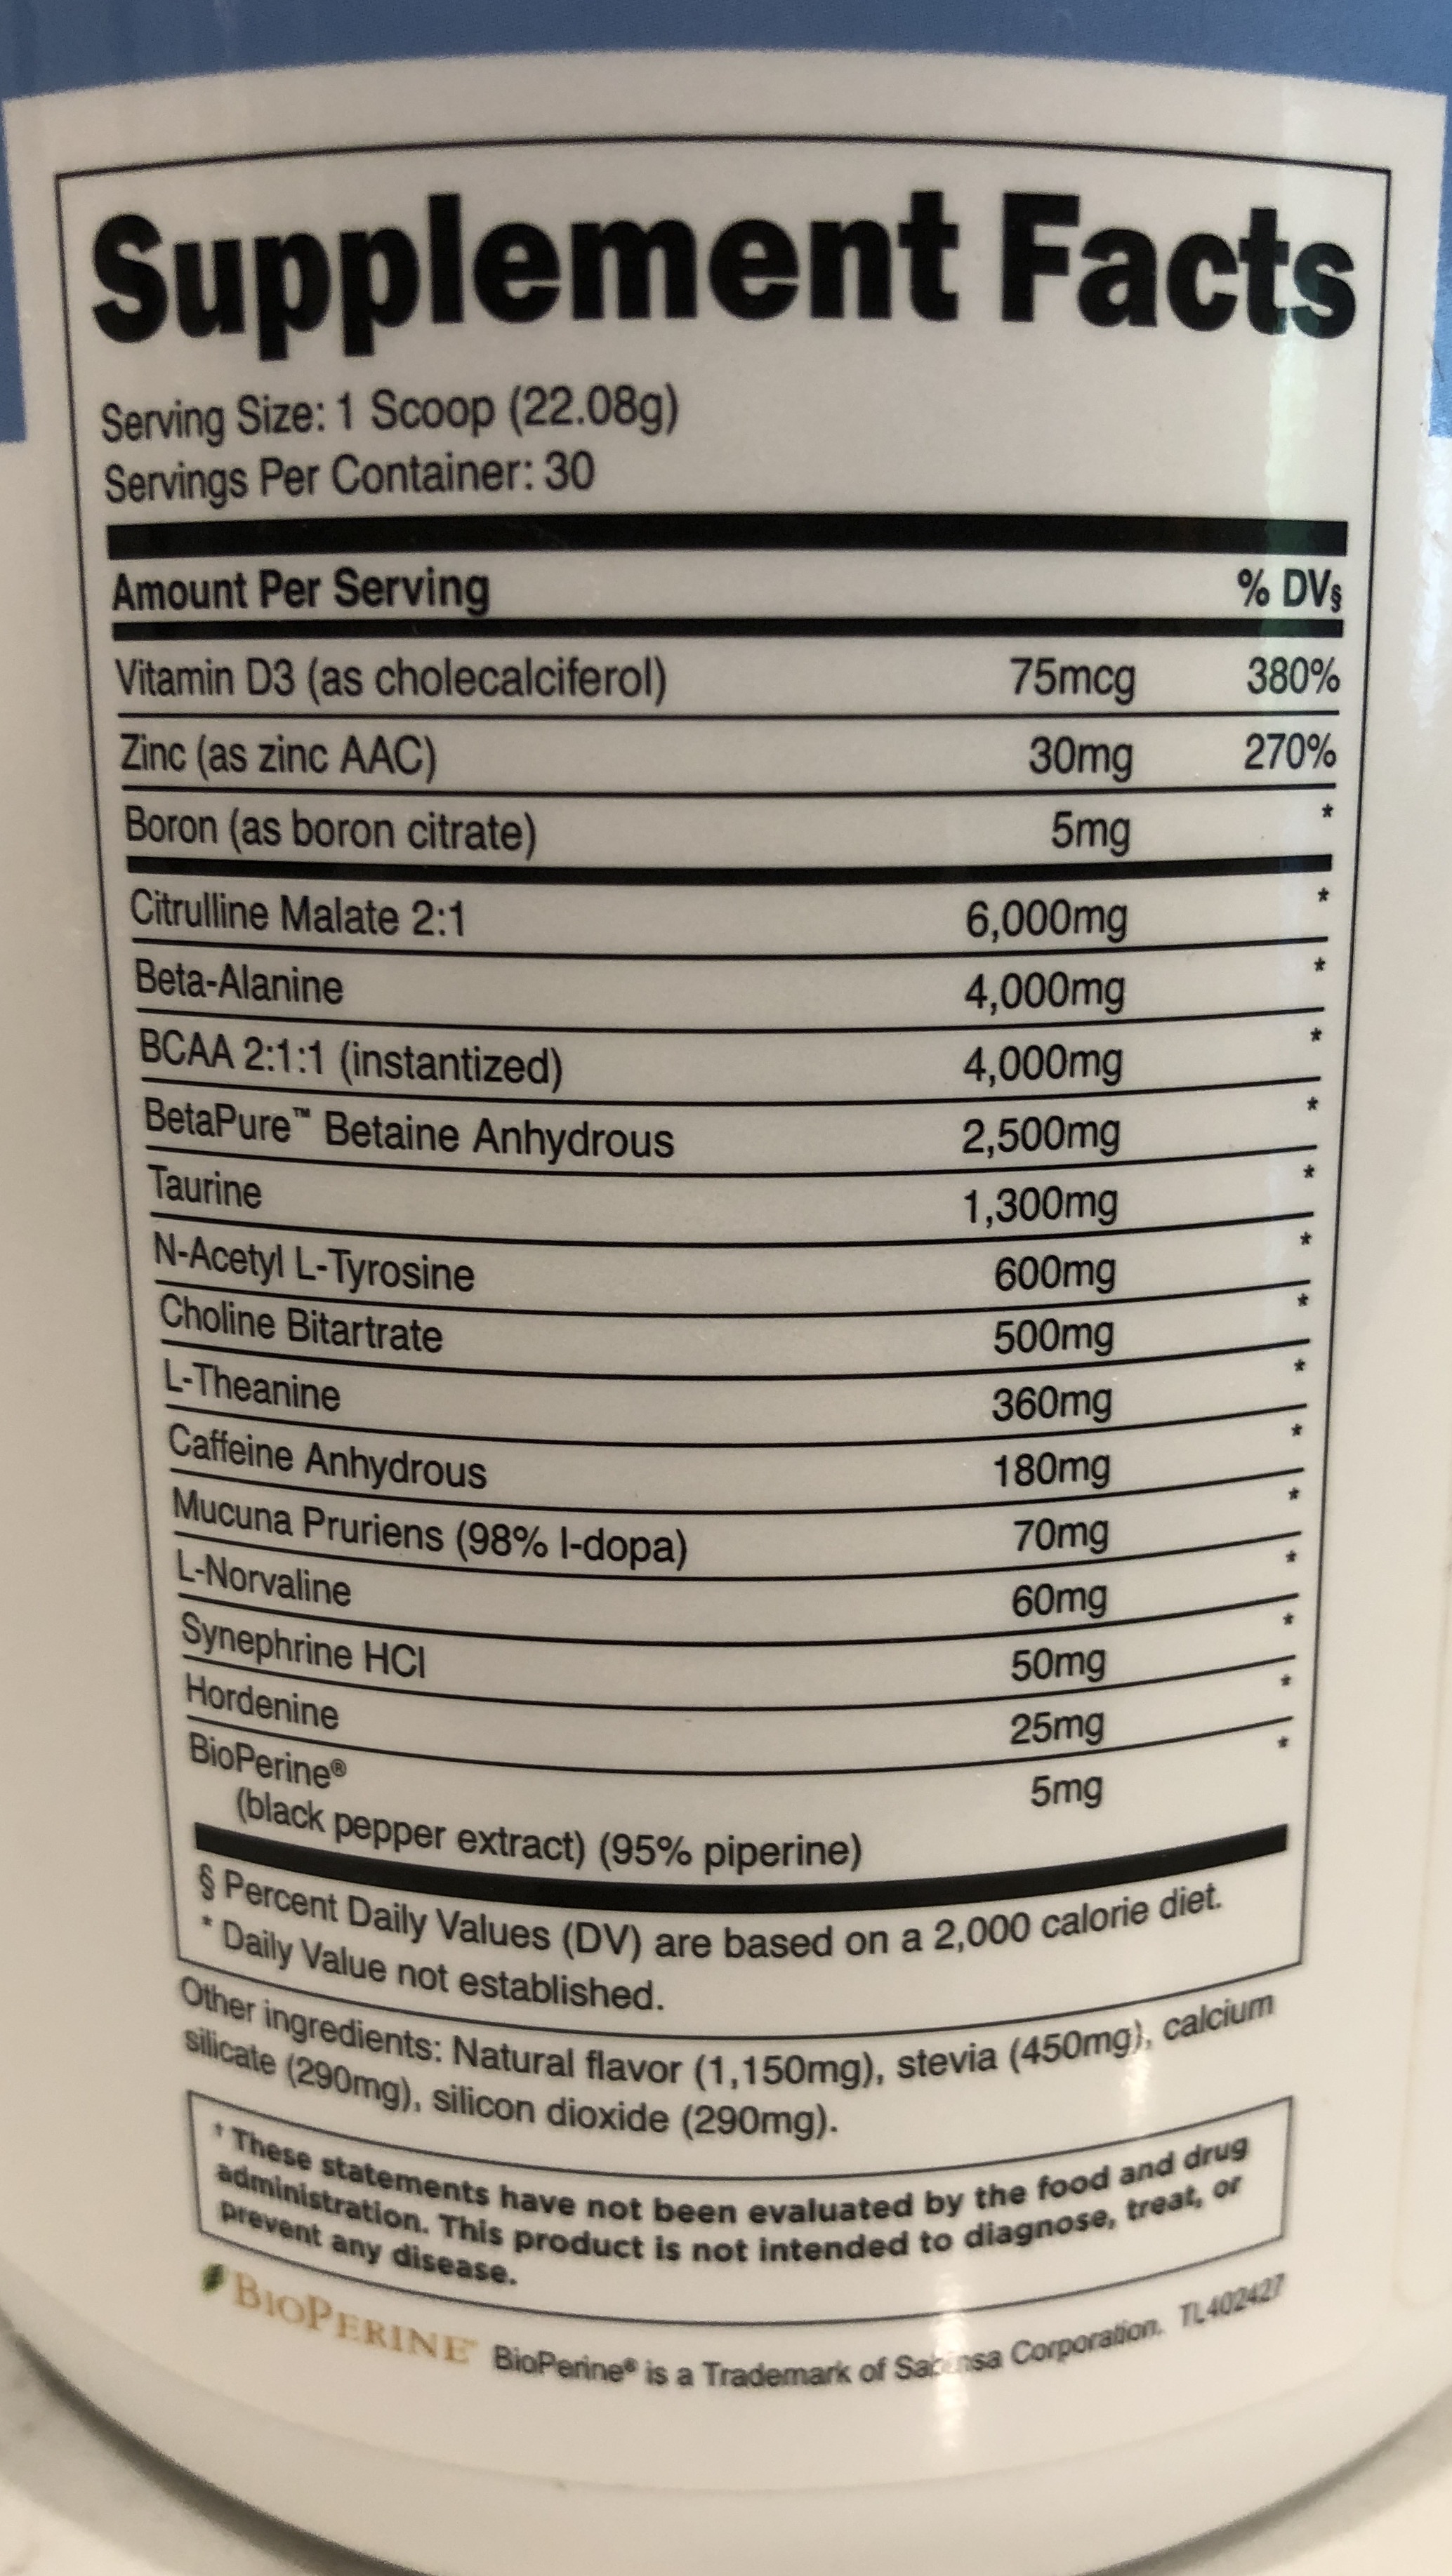
    This is an example of a nutrition label of a pre-workout supplement. Always look at the supplement facts to see what ingredients your supplement contains!

    Supplements Generally Accepted to be Safe


    Creatine

    Creatine is one of the most popular supplements used by athletes looking to build lean muscle mass, maximize athletic performance, and increase strength. Typically, creatine is in the form of creatine monohydrate, a nitrogen-containing compound that can be obtained in the food we eat – from sources like meat and fish – or formed endogenously (or inside the body), from three specific amino acids: glycine, arginine, and methionine.

    Creatine helps in the production and recycling of ATP. Adenosine Triphosphate, or ATP,  is an organic compound responsible for being the main source of energy for essentially all bodily processes. Whether you’re running, lifting weights, or even carrying groceries inside, your body is consistently using ATP to produce energy. After your body uses ATP for energy, the chemical bi-product produced is adenosine diphosphate, or ADP. Your body then begins the process of recycling ADP back into ATP.

    With the help of creatine, ADP recycling is exponentially increased, improving muscular endurance and power. There have been over 300 scientific studies highlighting the effectiveness of creatine. In fact, over 70% of these studies show statistically significant results in muscle growth and performance while taking creatine over an 8-week period of time. In the fitness world, fitness experts advise taking 20mg of creatine monohydrate for about 1 week to saturate your cells with creatine. From there, you can reduce your intake to 5mg per day. Although supplementing with creatine doesn’t guarantee muscle growth and athletic improvement, it can certainly help with overall energy production in the body, if you supplement correctly. A potential drawback to creatine is that it has been shown to be hard on kidneys, especially in people with pre-existing conditions.  However, as always, you should consult your physician before starting new supplements. If you consult with your physician and supplement correctly, you can gain the benefits of using creatine in your workouts!


    Caffeine

    Ahh, caffeine – a familiar word to pretty much every student on a college campus (and probably to high school students). Caffeine takes many forms, whether you imbibe yours with coffee or espressos, or you take yours in a pill form. Caffeine is the world’s most popular central nervous system stimulant and performance-enhancing supplements. It has become such a prolific supplement that it seems the world runs on caffeine.

    In fact, supplementing with caffeine has been scientifically proven to have significant ergogenic effects on aerobic and anaerobic activities (think endurance and sprinting, respectively).

    Caffeine is able to give you that desired jolt of energy by activating adenosine receptors in your brain. Consequently, dopamine floods your brain and causes increased neuron firing. The pituitary gland senses this activity and stimulates your flight-or-fight response, causing your body to release adrenaline. This chemical cascade is why caffeine makes you feel awake and energized. Caffeine acts as a muscle and chemical stimulant as well as a brain stimulant.

    While working out, caffeine can empower your body to push through even the hardest workouts, while keeping you focused on getting your next weightlifting or running personal record. Most workout supplements will have 120 – 180mg of caffeine per serving. Taking caffeine in the appropriate amounts can push you through your workout. However, since workout supplements are not FDA regulated, some supplements will include over 500mg of caffeine, claiming to give you the best workout of your life. However, healthy adults should not consume more than 400mg of caffeine per day – actually, it’s quite unsafe and unhealthy to consume more. So, when you go to take your next workout supplement, make sure to check the nutrition label for how much caffeine it includes and be sure that taking it doesn’t interfere with your morning cup of coffee or tea!


    Beta-Alanine

    If you use workout supplements, especially pre-workout supplements, you’ve most likely heard of Beta-Alanine. Beta-Alanine is a non-essential amino acid that is produced naturally in the body. In the body, Beta-Alanine aids in the production of carnosine. Carnosine is important for many normal body functions including the proper function and development of your muscles, heart, liver, kidneys, brain, and other organs. The exercise world focuses on carnosine’s role in muscle endurance in high-intensity exercises, such as weightlifting.

    Since Beta-Alanine helps in the production of carnosine, supplements typically include Beta-Alanine in pre-workouts geared for weightlifting or other high impact exercise activities. Because carnosine is specifically linked to muscle endurance, it is thought to help create longer weightlifting workouts, in turn leading athletes to true muscle exhaustion, consequently leading to muscle growth.

    Although science generally supports Beta-Alanine’s support in the creation of carnosine, there is still quite a bit of research that needs to be undertaken to verify the efficacy of the supplement. In general, the recommended effective and safe dose for Beta-Alanine is around 3-6 grams. Taking more is not advised as the safety effects of taking more have not been proved to be more effective nor safe. Interested readers should be cautious, however, when taking this supplement. Beta-Alanine can cause a tingling sensation in their body, called paresthesia. This tingling sensation stems from central nervous system stimulation and muscle stimulation. Though completely harmless, people that are sensitive to these kinds of body effects should either reconsider taking Beta-Alanine or take it in lower doses to assess tolerance.

    In general, Beta-Alanine is a great, generally safe supplement to use in sports and weightlifting. As always, consulting your physician is always smart before starting any new supplement. However, users in good health are generally safe and benefit from taking Beta-Alanine in supplementing for their workouts.

    Supplements you should not be taking:


    DMAA

    1,3 Dimethylamylamine (a.k.a. 1,3-DMAA or DMAA) is a substance made synthetically in laboratories. Surprising, it was originally used as a nasal decongestant in medicines from around the 1960s. Today, 1,3-DMAA is sold as a dietary supplement for a myriad of reasons including ADHD, weight loss, and improving athletic performance, as DMAA is classified as a stimulant. Many athletes take 1,3-DMAA to improve performance, without understanding the effects on the body.

    However, it was determined that DMAA is chemically too close to drugs and controlled substances like certain amphetamines – it even causes failures on drug tests for drug-tested athletes. Consequently, DMAA was added to the World Anti-Doping Agency’s prohibited substances list in 2010. Its use has been linked to several reports of serious, life-threatening side effects. You definitely should stay away from any workout supplement that includes this in their proprietary blend or ingredient list!


    DMHA

    Like DMAA, 1,5-Dimethylhexylamine (DMHA) was originally used as a drug for nasal congestion, similar to drugs such as pseudoephedrine, etc. Today, DMHA is included as an ingredient in dietary supplement products to supposedly boost workout performance or for weight loss. DMHA is very close to DMAA, but unlike DMAA, DMHA is currently not illegal. However, because of its close relation with DMAA and other amphetamines and controlled substances, many professional athletic communities actively advise against using any supplement with DMHA (i.e. NCAA for US college sports). While DMAA is a very potent stimulant that will definitely make even the hardest workouts feel ‘easy’, there are no studies to show the safety of DMAA, and there have even been reports of severe side effects from ingesting DMAA. If you see a workout supplement that includes DMAA, you should definitely not take it!


    NSF label

    NSF label
    When in doubt, check for the NSF label!

    If you doubt your ability to check a supplement’s ingredient list, it’s always a good idea to check if the product has an NSF label. NSF is the National Sanitation Foundation which was established to standardize food safety requirements. This organization is composed of chemists, biologists, nutrition experts, doctors, and more, who test and validate sports supplements (among other products) for their safety and efficacy. In fact, the U.S. NCAA mandates that athletes only take workout supplements with the NSF label, as this ensures the product does not contain any banned or harmful substances. If you choose a product that has the NSF label, you can be sure that the supplement is scientifically proven to be effective, generally accepted to be safe to use, and will not have any banned substances of any kind.


    Ask your physician and go crush your workout

    Now that you are aware of the more popular “generally accepted to be safe” supplements, as well as the supplements that you shouldn’t take, I hope that you are more informed when it comes to decisions about the supplements you take. In general, you should not begin taking new supplements until you have consulted with your physician. This article is by no means seeking to give advice; this article only seeks to bring awareness. Now get out there, be safe with your supplements, and crush your next workout!


    Notice: Pictures featured in this article are not to be considered an endorsement of that specific product.


    Sources:

    Kreider, R. (2003, February). Effects of creatine supplementation on performance and training adaptations. Retrieved November 01, 2020, from https://pubmed.ncbi.nlm.nih.gov/12701815/

    Grgic, J., Trexler, E., Lazinica, B., & Pedisic, Z. (2018, March 5). Effects of caffeine intake on muscle strength and power: A systematic review and meta-analysis. Retrieved November 01, 2020, from https://www.ncbi.nlm.nih.gov/pmc/articles/PMC5839013/

    Ratini, M. (2019, January 30). Beta-Alanine: Uses and Risks. Retrieved November 01, 2020, from https://www.webmd.com/vitamins-and-supplements/beta-alanine-uses-and-risks

    NIH. (2019). Paresthesia Information Page. Retrieved November 01, 2020, from https://www.ninds.nih.gov/Disorders/All-Disorders/Paresthesia-Information-Page

    WebMD. (2018). 1,3-Dmaa: Uses, Side Effects, Interactions, Dosage, and Warning. Retrieved November 01, 2020, from https://www.webmd.com/vitamins/ai/ingredientmono-1258/1-3-dmaa

    WebMD. (2018). Dimethylhexylamine (Dmha): Uses, Side Effects, Interactions, Dosage, and Warning. Retrieved November 01, 2020, from https://www.webmd.com/vitamins/ai/ingredientmono-1538/dimethylhexylamine-dmha

  • Neuromyths: What We Know, and What We Think We Know

    Neuromyths: What We Know, and What We Think We Know

    TAKE THE QUIZ HERE: https://www.tryinteract.com/share/quiz/5f7fc0088a3cf300140577ed

    Neuroscience is an ancient subject, but a very young science. 

    What I mean by that is, while people have been fascinated with the concepts relating to the mind and consciousness for as long as we have recorded records, the scientific, empirically supported study of the nervous system is a relatively new field. Our innate curiosity to understand ourselves and how we interact with the world, paired with the relative lack of scientific literature, might be one of the reasons there are so many false beliefs about the brain and nervous system in mainstream culture.

    In fact, public misconceptions about neuroscience are such a common phenomenon that we have a specific word for them: neuromyths. This term was coined by neurosurgeon Alan Crockard in the 1980s as a way to describe widespread but unscientific beliefs about the brain in the medical community and was formally re-defined as a “misconception generated by a misunderstanding, a misreading or a misquoting of facts scientifically established (by brain research) to make a case for use of brain research in education and other contexts” by the Brain and Learning project section of the UK’s Organization of Economic Co-operation and Development (OECD)  in 2002.

    People have been noticing this trend, however, and have tried to explain where neuromyths come from, and why they are so convincing to so many. They have noted that these false notions persist in a strange manner, similar to the way that illusions can continue to seem real even after facts have been presented (Pasquinelli, 2012), or the way that urban legends are resilient and appealing regardless of the presence or lack of evidence (Brunvald, 1981). Neuromyths are often vaguely rooted in some true research, albeit research that is largely misinterpreted, overblown, or entirely overturned by the academic community. This, along with inaccurate or sensationalist reporting of neuroscience discoveries in popular media, may be what gives them such an air of credibility, and why they are as potent as they are. 

    Some of these ideas seem intuitive. Others, like the popular commercialized Brain Gym regimen which purports that rubbing areas of tissue around the sternum (called “brain buttons”) can help improve interhemispheric communication among other things, sound less feasible from the start (Hyatt, 2007). As quirky, benign, or even downright ridiculous as neuromyths can seem though, they are not harmless.  For every well-intentioned dollar and minute spent implementing policies based on pseudoscience, there are fewer resources left to give to evidence-based scientific principles. Like any opportunity-cost model, neuromyths “cost” a lot in terms of what we “could” be teaching and applying about the brain.” They also “cost” us in terms of public receptiveness and curiosity for new research. By simplifying complex topics and claiming knowledge we don’t actually have, neuromyths can give the impression that certain ideas are already “solved problems”,  when they are still questions we should be actively pursuing. In addition, when neuromyths are disproven, they may make people less trusting of true results from studies, since the previous “science” they heard wasn’t right. It lends substance to the notion that scientists are constantly “flip-flopping” on topics, hastily publishing results and then issuing retractions left and right, although the original claims were never made by scientists  in the first place. Allowing neuromyths to pass unchecked as truth undermines the credibility of neuroscience, and ultimately science as a whole, by propagating ill-informed ideas with the authority that the disguise of a “lab coat” gives the public.

    Given this context, it’s time to start challenging the beliefs we hold and start to critically differentiate between the “urban legends” of neuroscience and data-supported hypotheses. Try your hand at this quiz to see how well you know what is and is not true about the human brain and nervous system!

    TAKE THE QUIZ HERE: https://www.tryinteract.com/share/quiz/5f7fc0088a3cf300140577ed

    References:

    Bangarter, A., & Heath, C. (2004). The Mozart effect: Tracking the evolution of a scientific legend. British Journal of Social Psychology, 43, 605– 623.

    Boyd, R. (2008, February 07). Do People Only Use 10 Percent of Their Brains? Retrieved October 24, 2020, from https://www.scientificamerican.com/article/do-people-only-use-10-percent-of-their-brains/

    Craik, F. I., & Lockhart, R. S. (1972). Levels of processing: A framework for memory research3. Journal of Verbal Learning and Verbal Behavior, 11(6), 671-684. doi:10.1016/s0022-5371(72)80001-x

    Craik, F. I. M. & Tulving, E. (1975). Depth of processing and the retention of words in episodic memory. Journal of Experimental Psychology, 104(3), 268-294.

    Crockard, A. Confessions of a brain surgeon. New Scientist 2061, 68 (1996).

    Giuffre BA, Jeanmonod R. Anatomy, Sciatic Nerve. [Updated 2020 Jul 31]. In: StatPearls [Internet]. Treasure Island (FL): StatPearls Publishing; 2020 Jan-. Available from: https://www.ncbi.nlm.nih.gov/books/NBK482431/

    Draganski, B., & May, A. (2008). Training-induced structural changes in the adult human brain. Behavioural Brain Research, 192(1), 137-142. doi:https://doi.org/10.1016/j.bbr.2008.02.015

    Driemeyer J, Boyke J, Gaser C, Büchel C, May A (2008) Changes in Gray Matter Induced by Learning—Revisited. PLOS ONE 3(7): e2669. https://doi.org/10.1371/journal.pone.0002669

    Howard-Jones, P. Neuro, science and education: myths and messages. Nat Rev Neurosci 15, 817–824 (2014). https://doi.org/10.1038/nrn3817

    Hyatt, K. J. Brain Gym: building stronger brains or wishful thinking? Remedial Spec. Educ. 28, 117–124 (2007).

    Koch, C. (2016, January 01). Does Brain Size Matter? Retrieved October 16, 2020, from https://www.scientificamerican.com/article/does-brain-size-matter1/

    Lodish H, Berk A, Zipursky SL, et al. Molecular Cell Biology. 4th edition. New York: W. H. Freeman; 2000. Section 21.1, Overview of Neuron Structure and Function. Available from: https://www.ncbi.nlm.nih.gov/books/NBK21535/

    Macdonald, K., Germine, L., Anderson, A., Christodoulou, J., & McGrath, L. M. (2017). Dispelling the Myth: Training in Education or Neuroscience Decreases but Does Not Eliminate Beliefs in Neuromyths. Frontiers in Psychology, 8(1314). doi:10.3389/fpsyg.2017.01314

    Organisation for Economic Co-operation and Development. Understanding the Brain: Towards a New Learning Science. (OECD Publications, 2002).

    Pashler, H., McDaniel, M., Rohrer, D., and Bjork, R. (2008). Learning styles concepts and evidence. Psychol. Sci. Public Interest 9, 105–119. doi: 10.1111/j.1539-6053.2009.01038.x

    Pasquinelli, E. (2012), Neuromyths: Why Do They Exist and Persist?. Mind, Brain, and Education, 6: 89-96. doi:10.1111/j.1751-228X.2012.01141.x

    Nielsen, J. A., Zielinski, B. A., Ferguson, M. A., Lainhart, J. E., & Anderson, J. S. (2013). An evaluation of the left-brain vs. right-brain hypothesis with resting state functional connectivity magnetic resonance imaging. PloS one, 8(8), e71275.

    Rauscher, F., Shaw, G. & Ky, C. Music and spatial task performance. Nature 365, 611 (1993). https://doi.org/10.1038/365611a0

    Riener, C., and Willingham, D. (2010). The myth of learning styles. Change 42, 32–35. doi: 10.1080/00091383.2010.503139

    Ruigrok, A. N., Salimi-Khorshidi, G., Lai, M. C., Baron-Cohen, S., Lombardo, M. V., Tait, R. J., & Suckling, J. (2014). A meta-analysis of sex differences in human brain structure. Neuroscience and biobehavioral reviews, 39(100), 34–50. https://doi.org/10.1016/j.neubiorev.2013.12.004

    Treiman, R., Gordon, J., Boada, R., Peterson, R. L., and Pennington, B. F. (2014). Statistical learning, letter reversals, and reading. Sci. Stud. Reading 18, 383–394. doi: 10.1080/10888438.2013.873937

    Vellutino, F. R. (1979). Dyslexia: Theory and Research. Cambridge, MA: MIT Press.

    Wickelgren, W. (1981). Human learning and memory. Annu. Rev. Psychol. 32, 21–52. doi: 10.1146/annurev.ps.32.020181.000321

    Willingham, D. T., Hughes, E. M., and Dobolyi, D. G. (2015). The scientific status of learning styles theories. Teach. Psychol. 42, 266–271. doi: 10.1177/0098628315589505/;=   

    Wittbrodt MT, Millard-Stafford M. Dehydration Impairs Cognitive Performance: A Meta-analysis. Med Sci Sports Exerc. 2018 Nov;50(11):2360-2368. doi: 10.1249/MSS.0000000000001682. PMID: 29933347.

  • Milk’s environmental impact

    Milk’s environmental impact

         A big misconception is that milk is taken directly from a cow and put in a bottle.  But this is not entirely true as the process of turning raw milk into consumer milk is much more complicated than that. The process has an enormous environmental impact.  In recent years there has been a rise in popularity of plant-based milks because of its taste and health benefits, but are these new substitutes better for the environment?  The food sector has the highest consumption of water, and in fact, 86% of all the water in the world is used to grow food. The process of producing each type of milk generates their own water footprint.  A water footprint is an indicator of how much water both directly and indirectly is used by a customer or producer.  So you and I both have water footprints from eating food, driving our cars, taking showers, and many more things in our daily life.  The water footprint for milk is calculated by the total volume of freshwater that is, directly and indirectly, used to produce it.  The three main types of milk I am going to talk about will be cow milk, soy milk, and almond milk, and the water waste that is accumulated as part of the production process for these types of milk. 

         Growing up I always believed like many other people that milk came directly from a cow straight into the container.  But that is a huge misconception about the milk industry.  In reality, the milk needs to be processed multiple times before it can be packaged and shipped out.  Each year the milk industry generates 3.739 to 11.217 million m^3 of water waste. This amount of water is 1 to 3 times the volume of milk that is processed and packaged each year.  That means that for every 1L of cow milk 1,050L of water waste is generated.  Because of the lack of interest and knowledge in this topic from general people, many do not know the environmental impact that happens because of all the waste.  Some of this water waste accumulates during various systems of milk production in the factories, such as cleaning systems, cooling systems, and steam generators.  This cleaning system results in the clean water waste mixing with the cleaning solutions that are pumped through the unit.  This chemical mixture is still in the water when it is disposed of into the nearby river, land, and fields.  This chemical mixture is a highly odorous black sludge that can cause destructive environmental impacts.  

         Recently there has been a rise in the demand for milk alternatives that provide better health benefits.  Because of this, there has also been a rise in many misconceptions about the environmental impact of these alterations.  I know when I first learned about alternatives like soy milk and almond milk, I believed that while they had great health benefits they also had positive environmental benefits along with it.  While they do have the least water waste with the processing of the milk; other areas of the production process also accumulate water waste.  With all three milk substitutes, there is an increase in water waste from the crop production of these products.  For soy milk, every 1 L generates 297 L of water waste.  

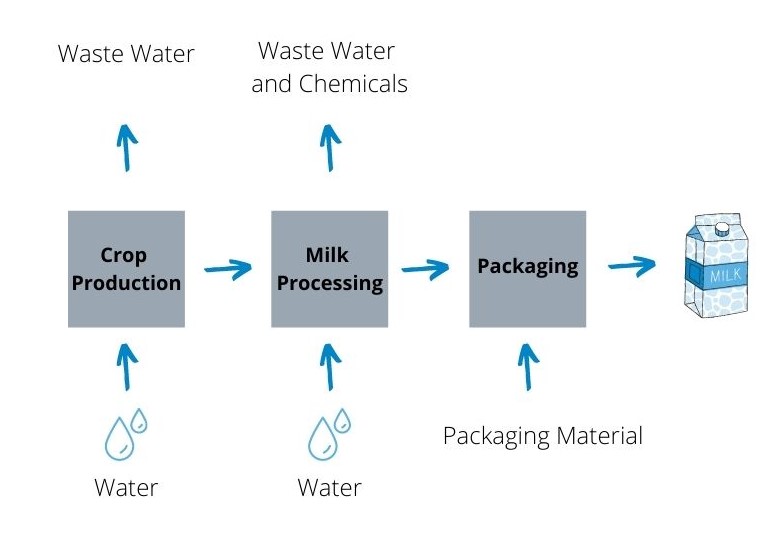
         Sadly out of the three milk options I looked at, there truly is no winner when it comes to lessening the environmental impact just based on picking a new milk substitute.  In the image, you can see the simplified engineering diagram for the production of milk.  In two of the stages for all types of milk, water is entering the system for crop production and the processing of milk.  While the amount of water that is used for each step is different depending on the milk, there still is an amount of wastewater that exists for each milk type.  But there are some ways production companies can adopt to decrease their water waste.  One way for almond milk would be to shift the sourcing and production of almonds to locations that have a more efficient irrigation system.  For cow milk, research might find a better way to streamline the process and to lessen the amount of chemicals introduced to water waste. 

    References: 

    Boguniewicz-Zablocka, J., Klosok-Bazan, I. & Naddeo, V. Water quality and resource management in the dairy industry. Environ Sci Pollut Res 26, 1208–1216 (2019). https://doi.org/10.1007/s11356-017-0608-8

    Courtney A. Grant and Andrea L. Hicks.Environmental Engineering Science.Nov 2018.1235-1247.http://doi.org/10.1089/ees.2018.0233

    Ercin, A., Aldaya, M., & Hoekstra, A. (2012, February 28). The water footprint of soy milk and soy burger and equivalent animal products. Retrieved October 08, 2020, from https://www.sciencedirect.com/science/article/abs/pii/S1470160X11004110?casa_token=e3EkrZ26r6IAAAAA%3Ad8BXC4T7XhPCDuL0uNN61qzA0XOht6XXqBIRrM1SH7_nN77SA7FbNk8jDSXLtqZUB29NnRasDXU

    Tikariha, A. , & Sahu, O. (2014). Study of Characteristics and Treatments of Dairy Industry Waste Water. Journal of Applied & Environmental Microbiology, 2(1), 16-22.

  • Electric Vehicles: Will EVs make our climate better?

    Electric Vehicles: Will EVs make our climate better?

    Electric vehicles have gained momentum in the recent years due to a considerable percentage of personal vehicle users as well as freight companies that converted from using internal combustion engine vehicles to some type of electric vehicles. Electric vehicles by definition, have at least some electric powerplant that powers the engine particularly or completely by one or more electric motors. This article forces on the environmental impacts of electric vehicles that entirely depend on batteries for storage and delivering  electric power for the motors.

    Plug-in hybrid electric vehicles (PHEVs) are being developed for a decade or so for mass production by the automotive industry by some major automakers. However, the rise of Tesla, the most valued automaker at the moment during the time of writing this article,  have pushed the limit of how an average car user can adopt completely to an all electric car and thereby save the environment from massive carbon footprint resulting from fossil fuels. PHEVs do not use any type of fuel other than battery packs that store and deliver energy. PHEVs have been touted for their potential to reduce the transportation system’s petroleum dependence and greenhouse gas emissions by using off-peak excess electric generation capacity and increasing the vehicle’s energy efficiency. As such, PHEVs are in a massive boom as several other companies have emerged with large financial backings that have pledged to produce EVs to save the environment and to ensure a zero emission transportation system in the future. The burning question is of course: do EVs actually have a significant impact in the improvement of environment?

    The U.S. Department of Energy’s has a Vehicle Technology Program that examines the precompetitive, high-risk research needed to develop the component and infrastructure technologies necessary to enable a full range of affordable cars and light trucks that are expected to reduce the U.S. dependence on imported oil and minimize harmful vehicle emissions, without sacrificing freedom of mobility and freedom of vehicle choice [1]. Although PHEVs are similar to the regular hybrid electric vehicles (HEVs), the battery can be charged using electricity from the grid by being recharged through a wall outlet. In terms of the overall environmental impact, PHEVs not only have direct impact as a result of not burning traditional fuels, but also the battery chemistry, the amount of grid electricity that can be stored in the battery, recycling ability of the raw materials, and the ability to give unused “power back to the grid” could significantly impact the environment. 

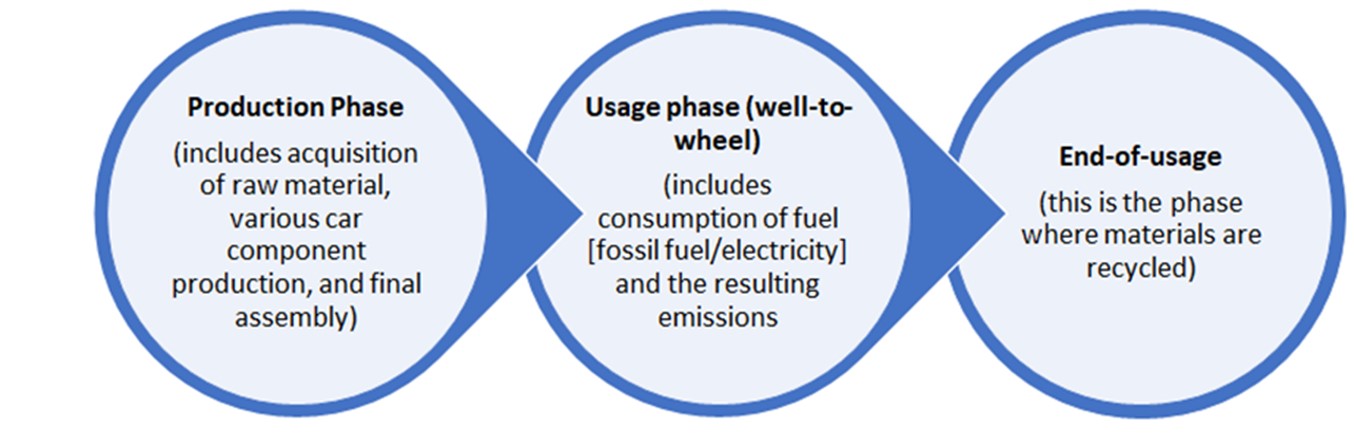
    Below is a schematic showing the life-cycle for a typical EV from production to termination of usage. An EV, by its nature of production type as well as type of usage, typically have less carbon footprint in each lifecycle phase compared to that of a fossil fuel burning vehicle.

    It is important to note that while PHEVs offer the potential for significant reduction in the usage of fossil fuel and resulting emissions of greenhouse gases, the actual benefit calculations need to take into account the upstream energy and emissions penalties that are associated with the electricity generation needed to power the charging systems and the load on the grid. Few studies have indeed taken all of these factors into account for certain vehicles that offer a choice of electric or internal combustion engine options for the same model. A study on the well known Volkswagen Golf model showed that, using the latest EU electricity mix, the current Golf TDI (Diesel) emits 140g CO2/km on average over its entire life cycle, while the e-Golf1 reaches 119g CO2/km. Based on the report, most of the emissions occur during the use phase of the internal combustion engine vehicle. Here the diesel reaches 111g CO2/km while a corresponding vehicle with electric drive emits only 62g CO2/km during the same phase [2].

    Key findings about EV and carbon emission

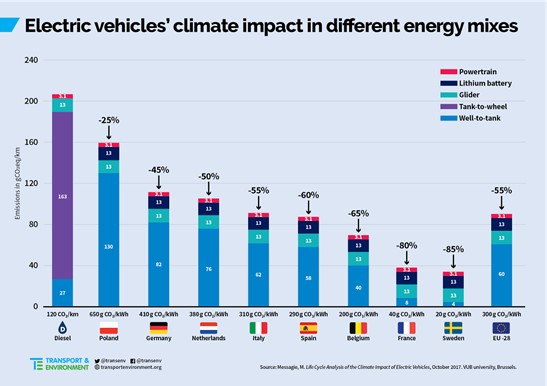
    1. Several european countries where EVs are prevalent have significantly more carbon-intensive power generation – due to reliance on coal plants – EVs still perform better there on a lifecycle basis, which includes the emissions in manufacturing the battery and vehicle. Based on the Polish average, an EV emits 25% less CO2 over its lifetime. In Sweden, which has one of the cleanest energy mixes in the EU, an EV emits 85% less than a diesel car [3]. The figure below shows a summary of the study [3,4].

          EV Climate impact for different Energy Mixes (reproduced from Transport and Environment) 
    2. Replacing a traditional ride-hailing car with an electric vehicle would deliver three times the environmental benefits and emission reductions, according to a new study. The finding comes as a new cost analysis shows that e-vehicles are cheaper to run for Uber drivers in many European cities, and Uber in Portugal says it will only take on new drivers if they have an EV.
    3. Both Uber and Lyft have made recent statements expressing their intention to move towards a totally electric fleet. But now, for the first time, a study has looked at what the environmental impact might be. The study by University of California’s transportation institute, looked at 400,000 journeys made in a battery EV by 1,000 ride-hailing drivers, and compared the impact with 118,668 journeys made in a petrol or diesel car, as well as over 15,000 in a plug-in hybrid EV [5].
    4. The biggest finding is that the potential environmental and emission reduction benefits of replacing a ride-hailing traditional car with an EV are ‘approximately three times higher compared with those of regular vehicle usage in California’, and on emissions alone this was ‘the most pessimistic scenario’. This is because vehicles owned by Uber, Lyft and other ride-hailing drivers are driven more than if they were only used for private use (about 305km on average per day compared to 48km) [5].
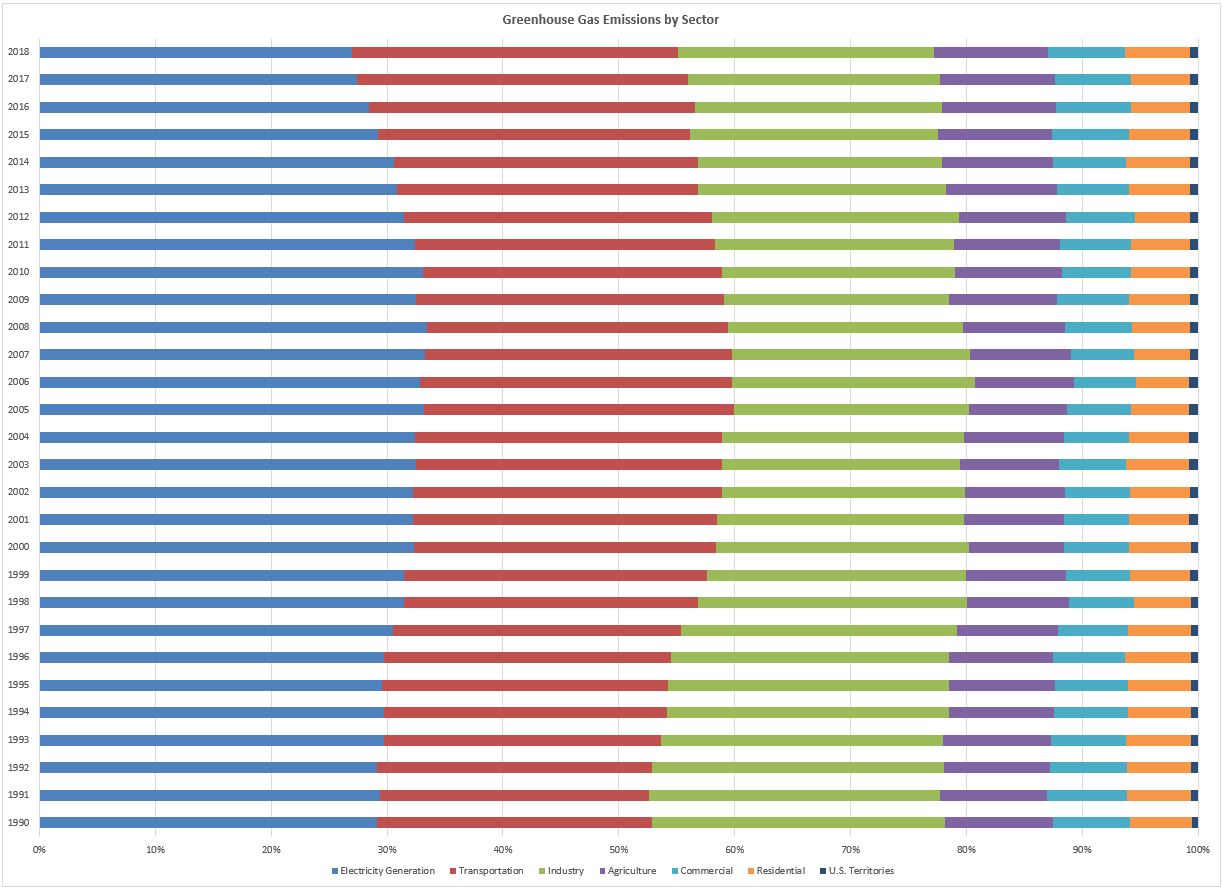
    5. Below is a chart based on data from EPA in the US for greenhouse gas emissions by different sectors [9] . Based on the data, it can be seen that transportation sector contributes to a large amount of green house emission. It will be interesting to see the insights about how EVs and PHEVs come into play.
    Share of Greenhouse Gas Emission by Sector

    How to calculate carbon footprint:

    Carbon offsetting funds solutions to reducing carbon emissions now. Frequently carbon offsetting reduces emissions much faster than you can as an individual/single company. Carbon offsetting projects help to combat global climate change as well as caring for local communities. In many instances providing much needed employment, health improvement, biodiversity,  reforestation and broad social benefits to impoverished communities.

    Calculator:

    This free to use online carbon calculator tool is independently audited on an annual basis as part of the Quality Assurance Standard (QAS) for Carbon Offsetting. 

    https://www.carbonfootprint.com/calculator.aspx

    Reference:

      1. Elgowainy, A., Burnham, A., Wang, M., Molburg, J., & Rousseau, A. (2009). Well-to-wheels energy use and greenhouse gas emissions of plug-in hybrid electric vehicles. SAE International Journal of Fuels and Lubricants, 2(1), 627-644.
      2. https://www.lowcvp.org.uk/news,vw-study-shows-co2-benefits-of-evs-over-whole-lifecycle_3946.htm (accessed October 2020)
      3. https://www.transportenvironment.org/press/electric-cars-emit-less-co2-over-their-lifetime-diesels-even-when-powered-dirtiest-electricity (Accessed September 2020)
      4. Messagie, M. (2014). Life cycle analysis of the climate impact of electric vehicles. Journal of Life Cycle Assessment, 2014, 14.
      5. Jenn, A. (2020). Emissions benefits of electric vehicles in Uber and Lyft ride-hailing services. Nature Energy, 5(7), 520-525.
      6. Noori, M., Gardner, S., & Tatari, O. (2015). Electric vehicle cost, emissions, and water footprint in the United States: development of a regional optimization model. Energy, 89, 610-625.
      7. Data from US Dept of energy: https://afdc.energy.gov/data/10347  (annual energy usage impact) (Accessed September 2020)
      8. https://afdc.energy.gov/data/10301  (US HEV sales by model) (Accessed September 2020)
      9. https://afdc.energy.gov/data/10802  (Green house gas emission by economic sector) (Accessed September 2020)