Category: Articles

  • A Look Back At How America’s Covid Response Failed

    A Look Back At How America’s Covid Response Failed

    Do you remember the days of 2020? Do you remember the uncertainty, the anxiety, and the constantly changing advice? Do you remember waking up every day, checking the news hoping for something better, but just seeing bad news after bad news? Perhaps, one of the most disheartening aspects of it was the expectations of scientists vs. what actually happened. At every turn, the virus proved more mysterious, complex, and unpredictable than what was anticipated. Every time, we thought that it was over and that we could declare mission accomplished, there was always something unexpected waiting for us. Taking a look back at some of these different moments during the Pandemic, my hope is to depict how the virus surprised us at every turn, and the lessons that we can take away for the next major Infectious Disease Outbreak.

    The first surprise that the virus threw at us was that the majority of us believed that our vaccines produced something known as sterilizing immunity. This was the ideal scenario because it meant that not only did the vaccine reduce the incidence of symptomatic and severe disease. However, it also reduced the incidence of infection and how frequently it was transmitted. This meant that, even if someone could not or chose not to get vaccinated, they would effectively be protected because the people around them could not spread the infection. This would decrease the overall community burden of Covid, along with the number of hospitalizations and deaths. Initially, it seemed like our vaccines had the potential to do this. For instance, there were studies in early 2021 showing that “The Pfizer vaccine reduced asymptomatic cases by 89.4%, and symptomatic cases by 93.7%”(Israeli Studies find Pfizer Covid-19 Vaccine reduces transmission). Similarly, many Israeli studies in the early part of 2021 observed the phenomenon that “Vaccines reduced the viral load in the respiratory tract of infected individuals, compared to unvaccinated people who were infected”(Israeli Studies find Pfizer Covid-19 Vaccine reduces transmission). Additionally, as Israel and the United States begun vaccinating their population, cases dramatically decreased. For instance, from January to May, Covid cases in Israel decreased from “1000 million per day to less than 3 per million”(What pushed Israel out of herd immunity? Modeling Covid-19 Spread of Delta and Waning Immunity). Unfortunately, these early signs of optimism were misplaced, and it clouded our judgement and took our eyes off the ball for the challenges that were about to come next.

    Around the same time that the incidence of Covid was decreasing in first world countries like the US, Israel, and the UK, the situation was extremely dire in India. In India, the number of infections were significantly increasing, along with the number of hospitalizations and deaths. The cause was not known yet, at the time. However, in April 2021 in India, “56-65-year-olds were spending an average of 13 days in the hospital”(Covid-19 Mortality in the Delta Wave in India: A Hospital-Based Study from Ramanagara District, Karnataka). Additionally, “77-84.62% of individuals in hospitals were completely out of breath, and WBC count was significantly elevated in over 40% of cases”(Covid-19 Mortality in the Delta Wave in India: A Hospital-Based Study from Ramanagara District, Karnataka).  In other words, there were early indications that there was something going on in India that was causing the pathogenicity of Covid to increase, and a significant number of people to get Covid to become seriously ill. To some extent, it was even more than what was seen during the initial Covid wave in New York or during the 2020 winter Covid wave in the United States. This was corroborated by the number of individuals “…needing significant levels of Oxygen”(Covid-19 Mortality in the Delta Wave in India: A Hospital-Based Study from Ramanagara District, Karnataka). Perhaps the largest red flag and warning sign in this situation should have been the fact that most of the population in India had already been infected, and supposedly developed immunity. According to some studies, “55% of India’s population may have been infected by January 2021″(India says it contains spread of COVID-19, no new cases in fifth of country). This only further proves that a new, pathogenic variant that was clearly immune-evasive, and especially adept at penetrating immunity induced by natural infection had arisen and would prove a significant threat to the United States, where so many people had still not been vaccinated. Indeed, the story of what happened in India repeated almost exactly in the United States 2-3 months later.

    So, America experienced the catastrophic effects of the Delta variant surge and then believed that everything was over. Surely there was enough immunity in America, so everything would be okay now, right? Unfortunately, the virus was still not done with us. Not only did our cases end up at a higher baseline than they were prior to the Delta surge. However, we then had a new variant arise in South Africa, which was good at evading all the immunity obtained from the Delta Variant, and previous variants. Specifically, “The reinfection rate of individuals who had been infected by other variants was up to 56% according to studies done by Qatar”(Protection against the Omicron Variant from Previous SARS-CoV-2 Infection). On the bright side, there were some positives on the horizon, though. The variant seemed to induce clinically milder symptoms and may have carried a lower risk of Long Covid. The variant also seemed to confer stronger protection to previous variants, suggesting that it was favored to be the dominant variant. For instance, studies showed that after having the Delta Variant, “Many individuals had a 6-fold increase in neutralization ability/capacity”(Omicron infection enhances Delta antibody immunity in vaccinated persons). This was unique to the Omicron variant, as other variants did not appear to provide such a broad immune response, especially to variants that were so dissimilar to it. This raised the hope that Omicron could signal a start to a more stable state with Covid because Omicron would be able to block reinfection, and infection, even if Covid experienced a significant number of mutations. Plus, the lower pathogenicity of Omicron would give it a survival advantage across populations, given that it would be less likely to kill its hosts. All that being said, while this prediction turned out to be somewhat true and the pandemic has remained stable after that point, with deaths and hospitalizations staying relatively stable in the US (albeit at a high level), and all subvariants being offshoots of Omicron, the 2021 winter Omicron wave caused a high rate of hospitalizations, deaths, and cases, even if it induced immunity in the process. 

    So you might be wondering, what exactly was the point of going down memory lane with Covid? What was the point of discussing all these events? What I hope that you gleamed from this article is that while the Covid-19 Pandemic had an end of sorts, and while we appear to be out of the unstable, uncertain phase of the Pandemic now, America’s response fell quite short in many ways. Any future Pandemics could be made worse, and if we do not focus on how to significantly improve our response, the level of suffering that we undergo then could be made way worse. For one, we needed to be way more proactive, not reactive. We needed to stop hoping that Covid would end by itself, and we needed to actually take the steps to end it. We needed to tightly restrict travel from other countries and put a lot of security measures in place to prevent variants from coming to our country. Similarly, we needed to distribute the vaccine much more equitably and put a much more all hands-on deck effort in getting the world vaccinated by early 2022. It would not have been easy, but it could have been done. Additionally, we needed to keep slight restrictions in place until the world was vaccinated, like having a Federal Mask Mandate to keep cases as low as possible, while vaccinating the world. Finally, with the level of genomic analysis that we have available in today’s day and age, we should have worked on predicting worst case mutations that Covid-19 could undergo and created backup vaccine formulas based on those mutations to have immediately ready the second that we heard of these new variants. All of that would have minimized the level of hospitalizations, deaths, and disruption that society had to undergo throughout this pandemic. So, if nothing else, I hope you as a reader takeaway one point from this article: We needed to do way better in our response, and we are lucky that this was not way worse than it already was!

    Sources:

    Lubell, Maayan. “Israeli Studies Find Pfizer COVID-19 Vaccine Reduces Transmission.” Reuters, Thomson Reuters, 19 Feb. 2021, www.reuters.com/article/health-coronavirus-israel-vaccine-int/israeli-studies-find-pfizer-covid-19-vaccine-reduces-transmission-idUSKBN2AJ08J/.

    De-Leon, Hilla, and Dvir Aran. “What pushed Israel out of herd immunity? modeling covid-19 spread of Delta and waning immunity.” medRxiv, 2021, https://doi.org/10.1101/2021.09.12.21263451.

    Mukhopadhyay, Amita, et al. “Covid-19 mortality in the Delta Wave in India: A hospital-based study from Ramanagara District, Karnataka.” Cureus, 2023, https://doi.org/10.7759/cureus.43678.

    Das, Krishna N. “India Says It Contains Spread of Covid-19, No New Cases in Fifth of Country.” Reuters, Thomson Reuters, 28 Jan. 2021, www.reuters.com/world/india/india-says-it-contains-spread-covid-19-no-new-cases-fifth-country-2021-01-28/.

    Altarawneh, Heba N., et al. “Protection against the Omicron variant from previous SARS-COV-2 infection.” New England Journal of Medicine, vol. 386, no. 13, 2022, pp. 1288–1290, https://doi.org/10.1056/nejmc2200133.

    Khan, Khadija, et al. “Omicron infection enhances Delta antibody immunity in vaccinated persons.” Nature, vol. 607, no. 7918, 2022, pp. 356–359, https://doi.org/10.1038/s41586-022-04830-x.


  • Diary of an Undergraduate Thesis

    Diary of an Undergraduate Thesis

    The Georgia Tech Research Option is available to all undergraduate students in the College of Sciences. It includes the completion of an undergraduate thesis. Students who choose to take on all this additional work are generally considered a bit sick in the head. Through these diary entries, I hope I can provide some insight into the joys and trials of completing this process. Particularly, for those who (for some reason) want to take on the same path.

    August 24, 2023

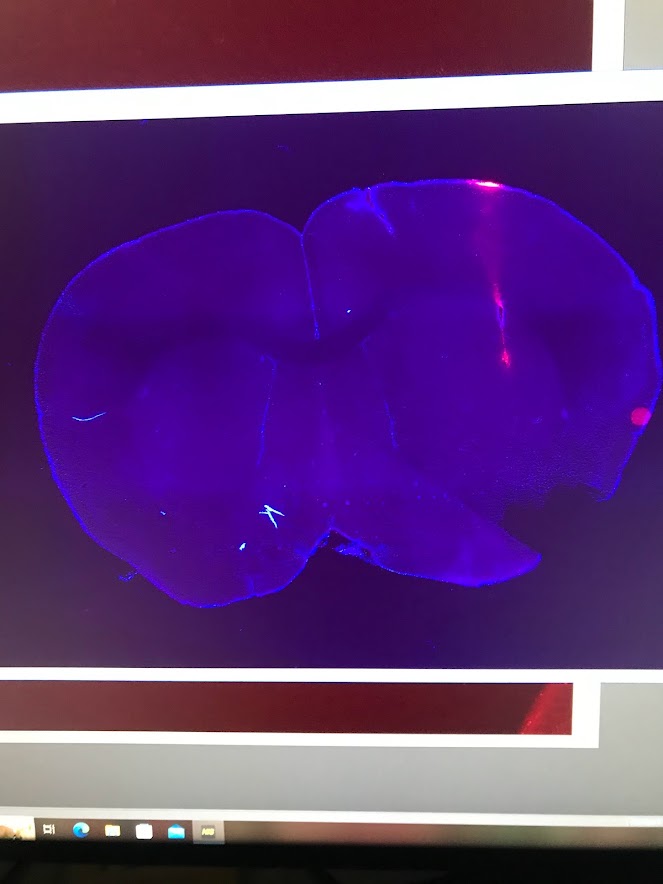
    Finally figured out the direction that I want my thesis to go in! This has been stressing me out quite a bit, so I’m glad I’m able to figure things out. I talked with my PI and we sort of figured out that I can do a project that combines the calcium sensors our lab has been developing and the dopamine recordings in freely moving mice that we’ve been doing. There’s still a lot of directions this project can go, but this sounds like a good place for me to start thinking (and just as importantly, looking at sources for the background section of my thesis). What I found super helpful is that my PI gave me a set of next steps if I want to pursue this project, which alleviated a lot of my uncertainty. Here they are:

    1. Get trained on stereotactic surgery (mouse brain surgery)
    2. Learning how to run and handle mice in our behavior rig
    3. Injecting mice with whichever thing we want to test (probably dopamine and the sensor at first)
    4. Running in vivo experiments

    As you can see, running experiments is step 4, after having to learn a lot of other stuff. Hopefully, I’ll be able to start that step in October/November, but if not I should be able to do it in spring. 

    We also discussed how there’s a huge gap in the literature that I honestly hadn’t really considered: we don’t really know how dopamine impacts the excitability of neuron populations. This seems like something really basic to the field, but we haven’t really had the tools to measure it until very recently. I don’t want to get too deep into the particulars of the field, but basically I’m glad that we’ve found something that I can reasonably say fills a need in this field of research. In addition to that being a required part of my thesis’ introduction, it makes me feel a lot more passionate about the work. I think a big challenge of this thesis will be staying motivated as the going gets tough, so this is good.

    My next steps will be to get trained on the techniques I’m planning to use and look at some papers for background.

    ——————————————

    October 6, 2023

    I have been super busy this past month and change. I have been practicing stereotactic surgery, which has proven to be really hard. While I’ve been working on experimental techniques, I’ve also been reading a ton of articles.

    Right now, I have around 25 articles in my Zotero (research sorting app), and I’ve read about 7. Although I’m improving in my ability to read research articles, it’s still taking such a long time. 

    Now, my literature review is due in two days, and I haven’t read all the papers yet. However, since it’s just a draft, I’ll try to use the background section of my PURA proposal as a base for it. I’m going on a trip tomorrow, so I really don’t want to work on it during my trip.

    I’m going to work on it now and just submit the draft. This thesis process has taught me to just turn something in, even if it isn’t perfect.

    ————————————–

    November 4, 2023

    Well–I think I’m at the point of the semester where it all feels like I’m fighting an uphill battle. Looking at my 4 step plan from August, I’m still working through step 1. My plan of conducting actual experiments in October was a little too rosy. One thing that’s slowed my progress is that although I’ve been practicing mouse surgery, I can only pretty much do one mouse per week. I share the surgery room with other people in the lab, and with scheduling around classes and other lab tasks, that’s all the time I have for practice. 

    Still, I feel like I’m making progress, slow as it is. This week, I’m going to be doing my first survival surgery, which is one step closer to being able to put in implants and biosensors into mice.

    On the writing side, it’s time for me to revise my lit review, introduction, and work plan and put them together. It’s also necessary for me to get all three (all together they’re called the proposal) signed off by my research advisor and second reader. Honestly, this part kind of scares me because I feel like I haven’t gone in depth enough for my lit review in particular. I’m meeting with my advisor later this week to show him my proposal, so I’ve got to get working on this today and tomorrow (the weekend). Currently feeling stressed out. But I keep telling myself that it’ll pass.

    The thing is–I really like doing research, and I find reading articles and learning more information about the topic interesting. But deadlines and expectations always scare me. Even so, I’m trying to tell myself that I have all the tools I need to succeed. I just need to be patient with myself.

    ———————————–

    December 1st, 2023

    Well, I’ve basically done all my revisions. My readers gave me some really helpful feedback, and it turned out that my proposal was in better shape than I originally thought. I just need to check some of the formatting, and then I’ll wait for the approval form to come out so I can submit it. 

    One thing I noticed–that I also talked to my advisor about–is the fact that when I’ve been working on my thesis, it’s made me think about why I am doing what I’m doing. Like it’s simple enough to say I’m working on a project that uses a biosensor, but when I started writing, I started thinking more about the details in a way that I never really did while just doing bench work. Why do we choose this type of biosensor? What gives our approach the advantage over another? In what way does our experimental setup even work?

    I think as undergrads, a lot of stuff is technically really complex and hard to grasp. So the researchers who are mentoring us simplify things so we can get a general gist of what’s going on. But when you’re writing your own thesis, or even making a presentation on your research, you’re encouraged to delve deeper into the reasoning behind what you do. And in that way, I think I finally kind of understand why a thesis was put into the curriculum of the research option. 

    As the semester is nearing its end, I’ve been thinking a lot about what I’ve done so far. And I feel like while I’m behind on my work plan, I still feel proud about what I’ve accomplished. It’s just an undergraduate thesis–I’m not really expected to produce groundbreaking. Still, I feel like the skills I’m learning (reading journal papers, scientific writing, study design, coordinating with my research advisor) are going to be really helpful in the future.

    Or, maybe I just feel like this because the pressure is off, for now. I’m going to put the final touches on my proposal now–see you next semester!


    Here is my followup to this article–the finale of my undergrad thesis journey!

  • The science and history of the PB&J sandwich

    The science and history of the PB&J sandwich

    The PB&J sandwich is a humble combination of sweet, salty, and creamy. Where exactly did this classic sandwich originate, and what are the details behind its nutritional value?

    Before the invention of the PB&J, its three essential ingredients had to be born, beginning with the peanut butter. In 1895, Dr. John Harvey Kellogg patented a process for creating peanut butter, and marketed it as a protein-rich source for patients who couldn’t chew solid food very well. In 1903, Dr. Ambrose Straub patented a peanut-butter-making machine. Peanut butter made its debut at the 1904 St. Louis World Fair, where its popularity skyrocketed [1, 2]. 

    Peanut butter was considered a delicacy during this time, and the first PB&J sandwich recipe was published by Julia Davis Chandler in the Boston Cooking School Magazine of Culinary Science and Domestic Economics. However, this recipe was intended to be served as delicate finger sandwiches at parties and in tea rooms [2, 3].

    Next comes the jelly. Marmalade and jam had been around for a long time, but the familiar purple jelly component of the PB&J was created when Paul Welch patented a method for pureeing grapes into jelly in 1917, naming it Grapelade [2].

    The final piece of the puzzle: sliced bread. The bread slicer was invented in 1928 by Otto Frederick Rohwedder. The availability of pre-sliced bread and the commercialization of the peanut butter industry increased the accessibility of the PB&J ingredients and popularized the sandwich across the nation [2, 3].

    Now that we know its origin story, let’s move on to the science of the PB&J. The nutritional breakdown: a typical PB&J has 15 grams of protein, 13 grams of fat, and 12.5 grams of sugar [4]. While a lot of sugar is never a good idea, for an active individual it can provide a needed burst of energy, and the combination with protein and fat ensures one feels full and satisfied. 

    According to a 2021 study from the University of Michigan School of Public Health, eating a PB&J can add up to 33 minutes to your life span [5]. This study assigned a health nutritional index that measured the health effects from the consumption of over 5,800 different foods, quantifying the results in minutes of healthy life gained or lost. The authors mention that this apparent health benefit of the PB&J is driven by the nut content of the sandwich, which is the source of the protein and fat. Therefore, while the PB&J is not a superfood, it is a much better option than some other processed foods, like hot dogs, which scored notoriously low during the study.

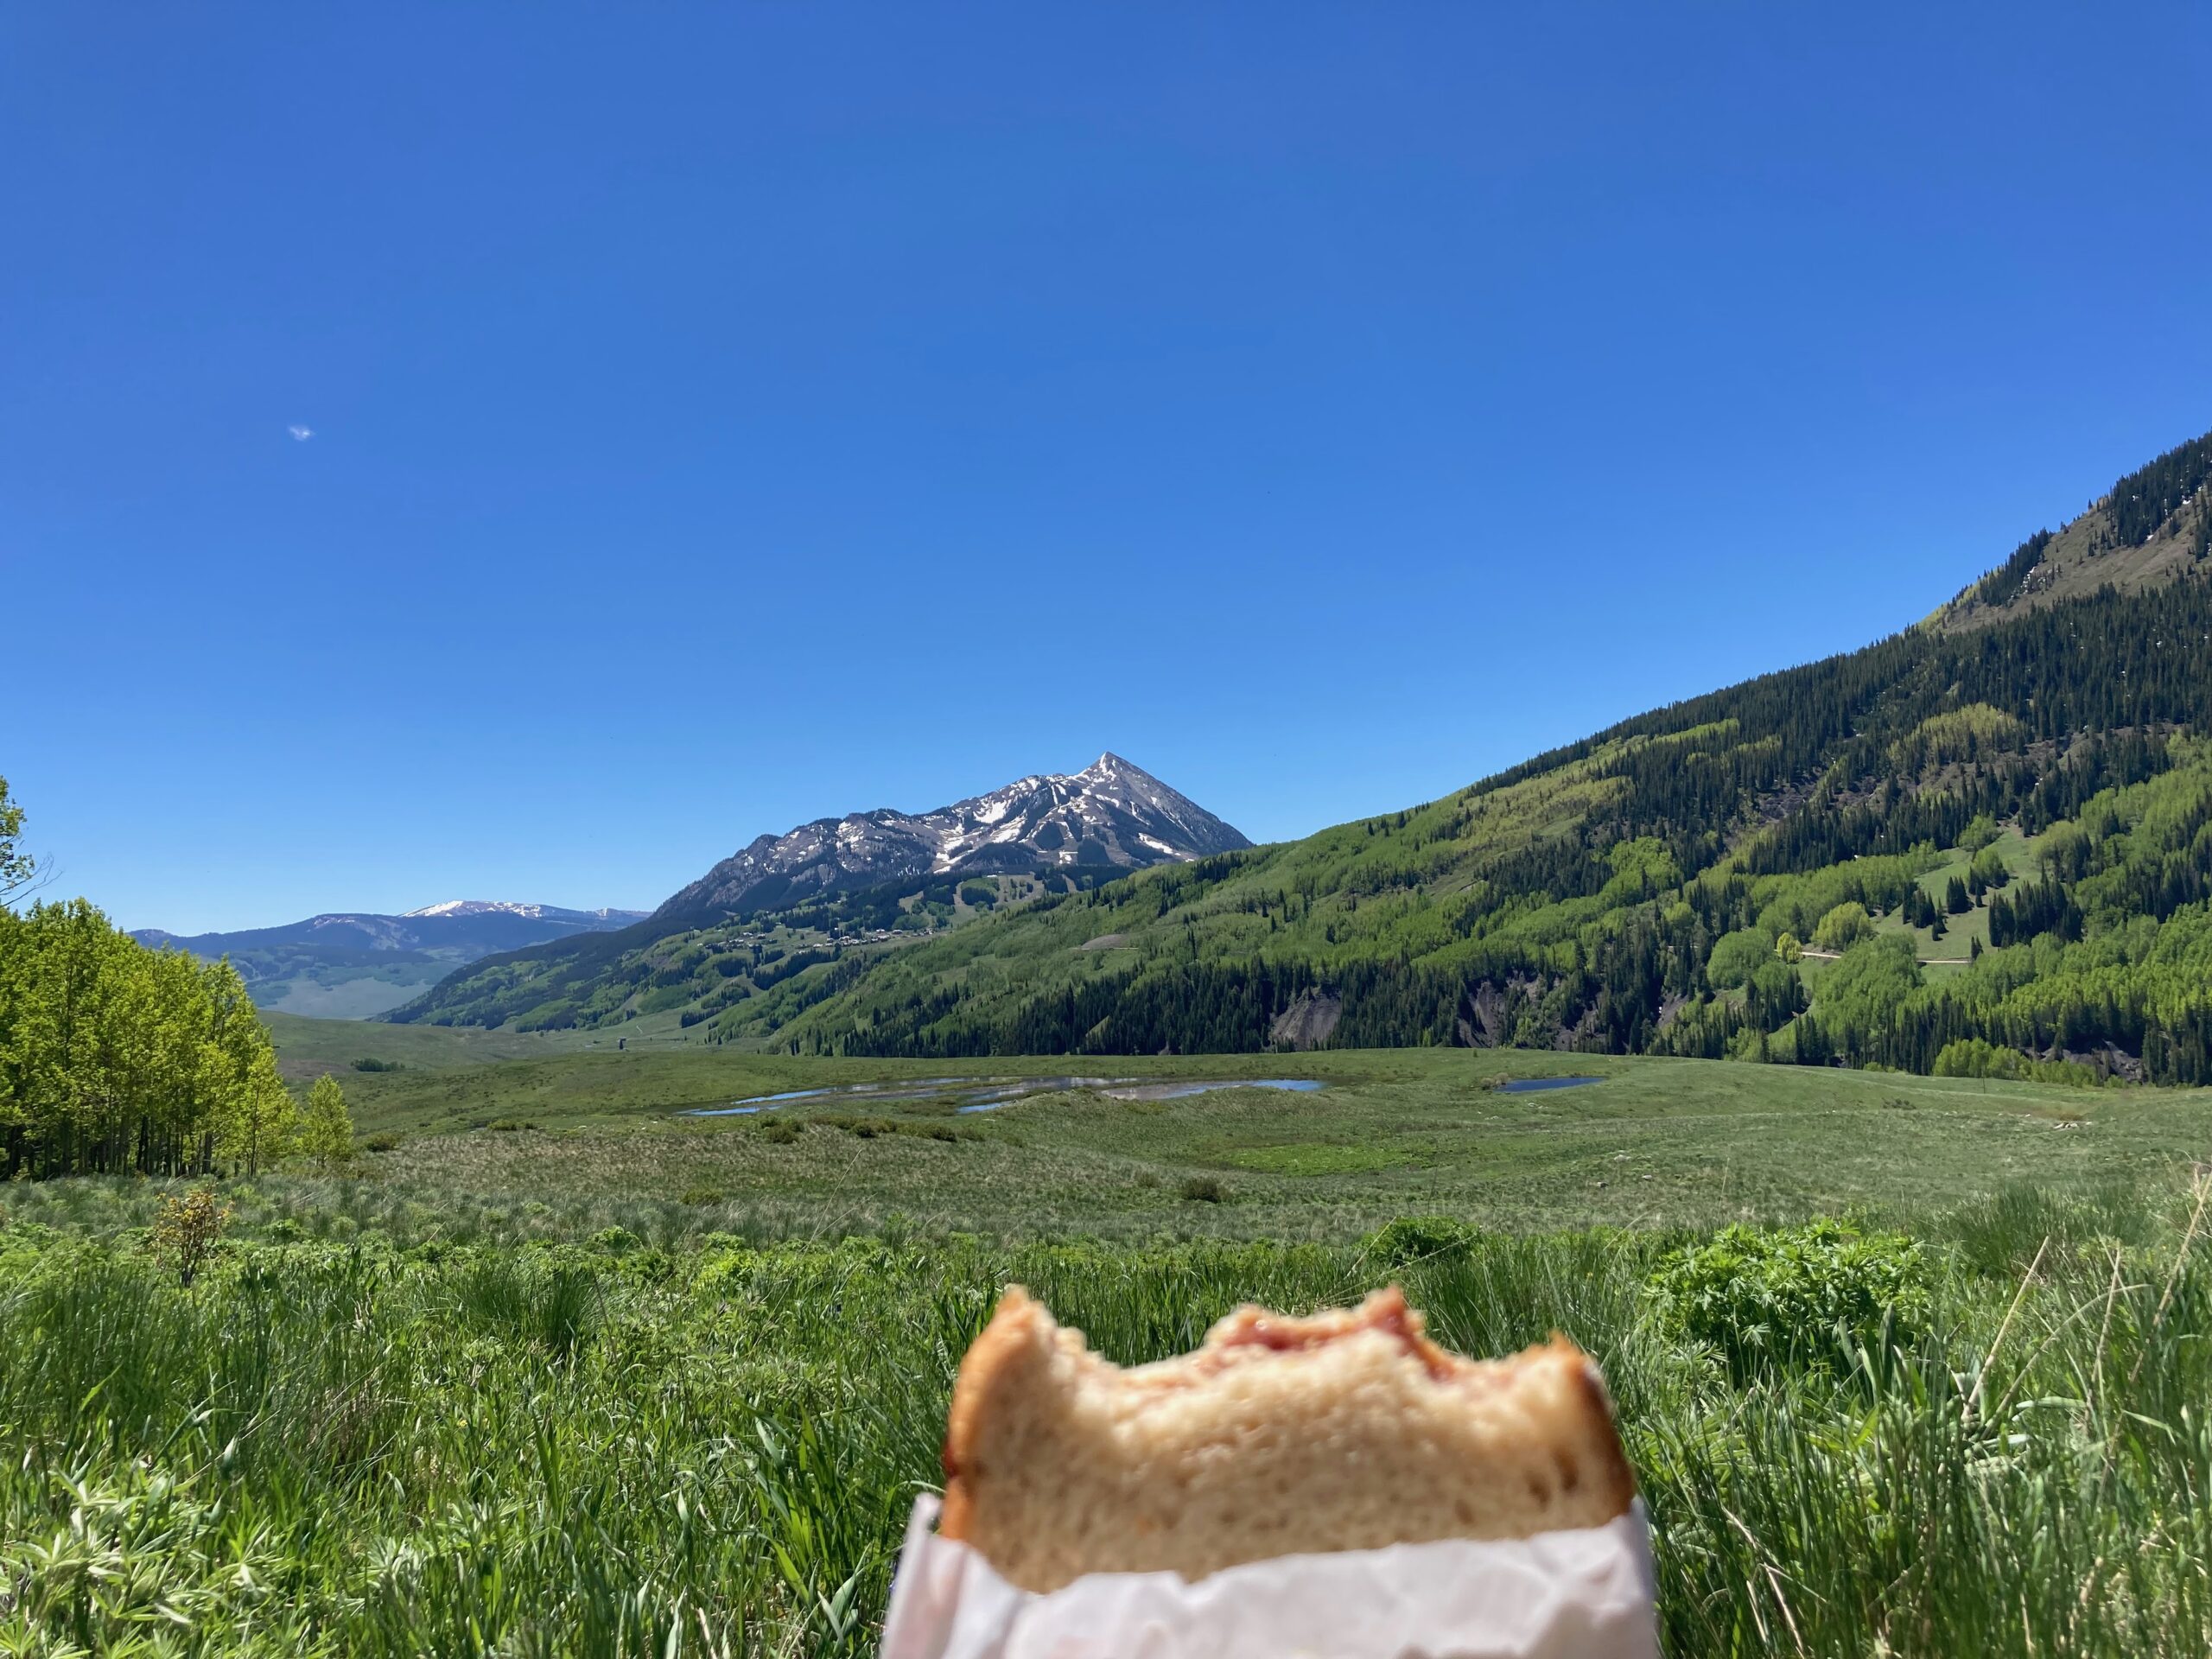
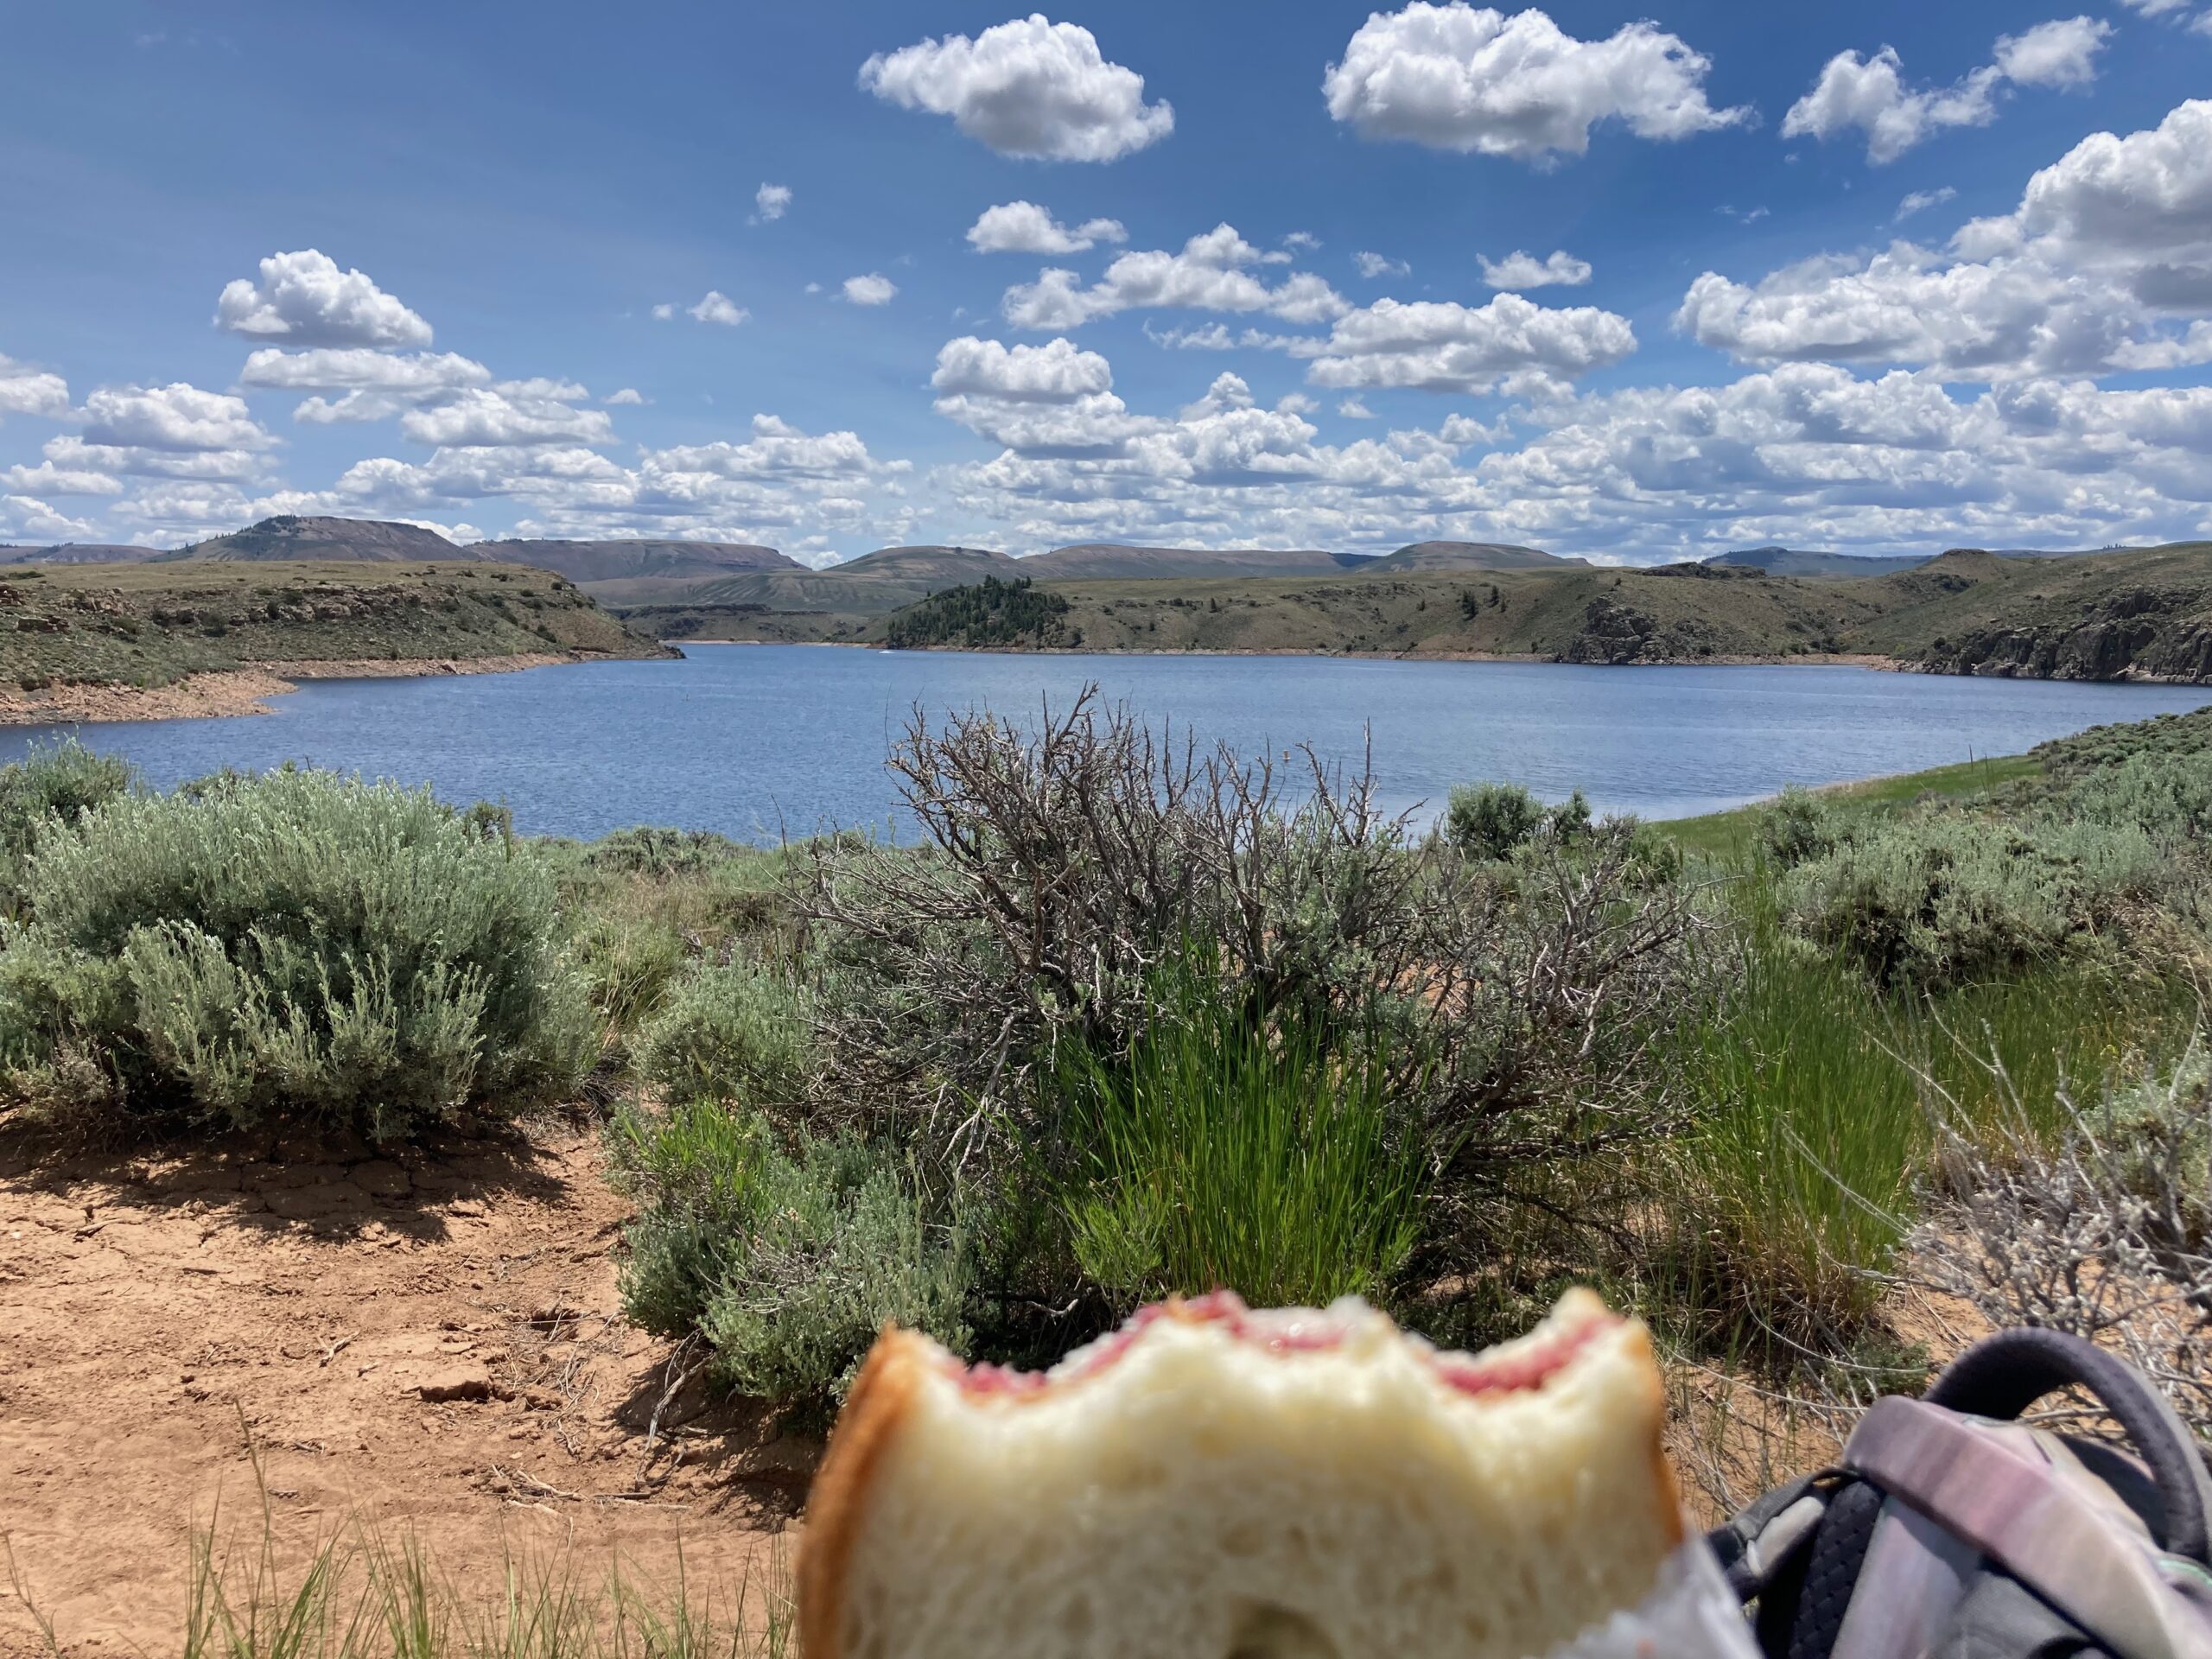
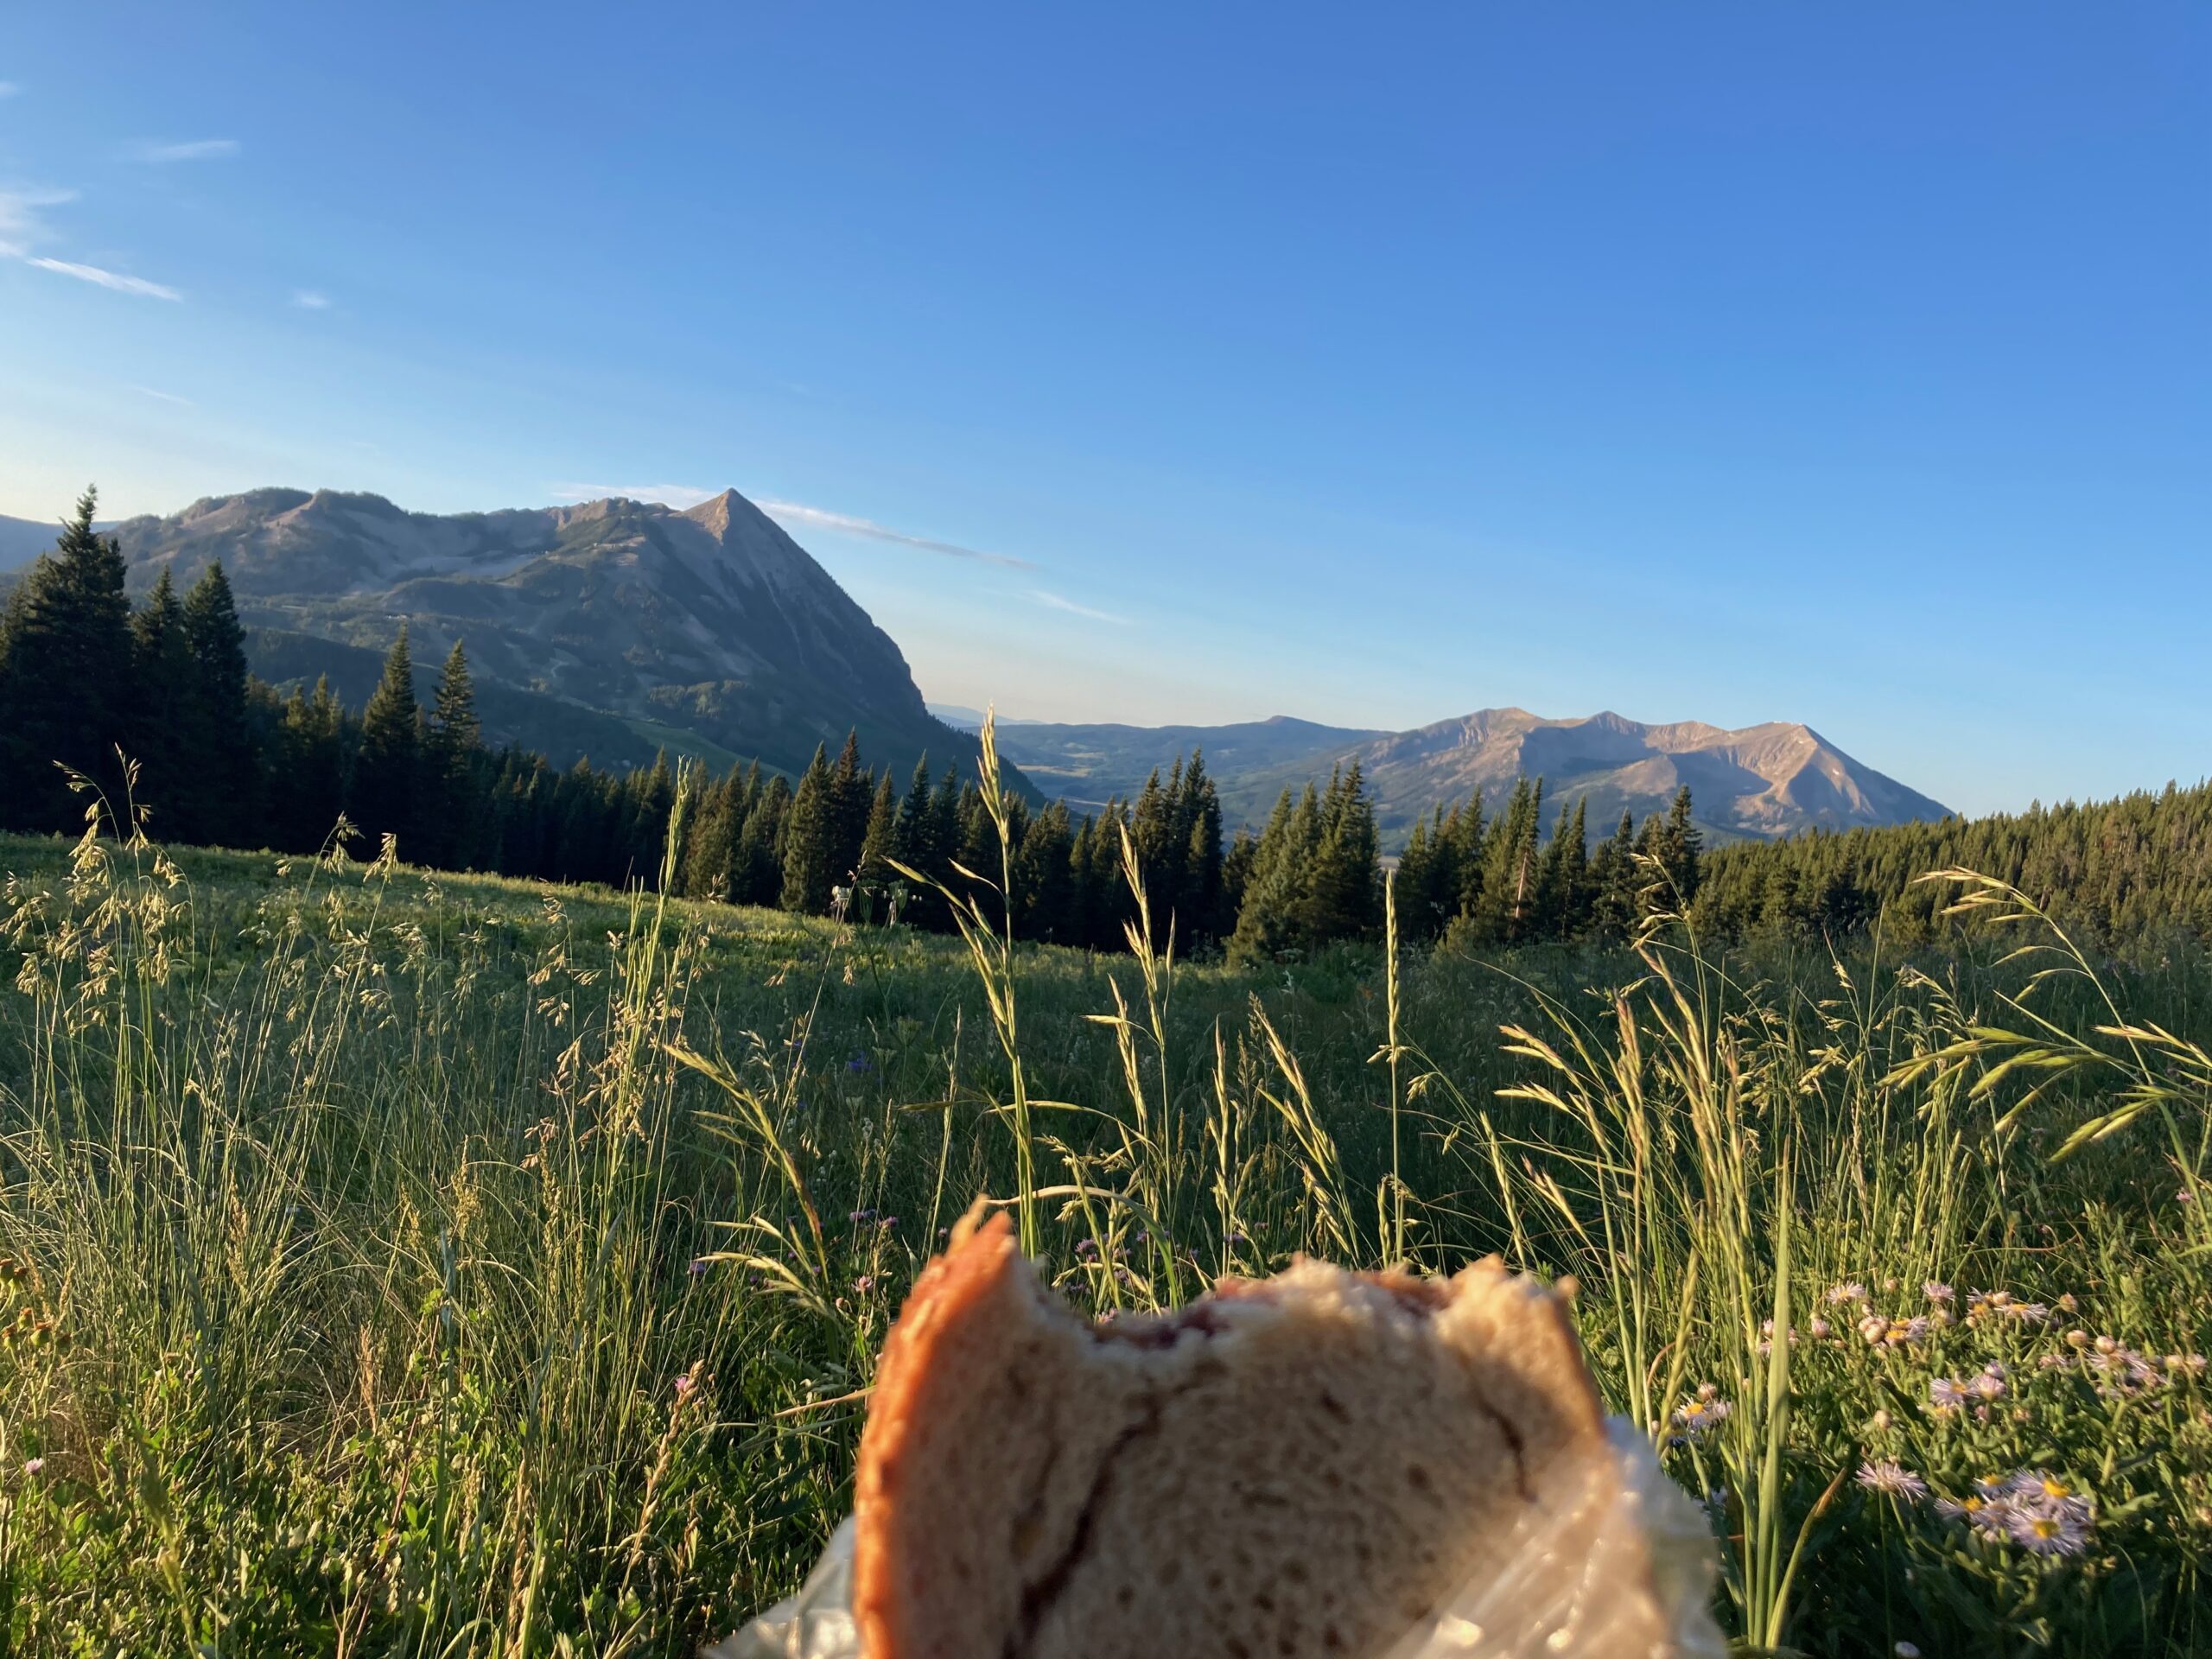
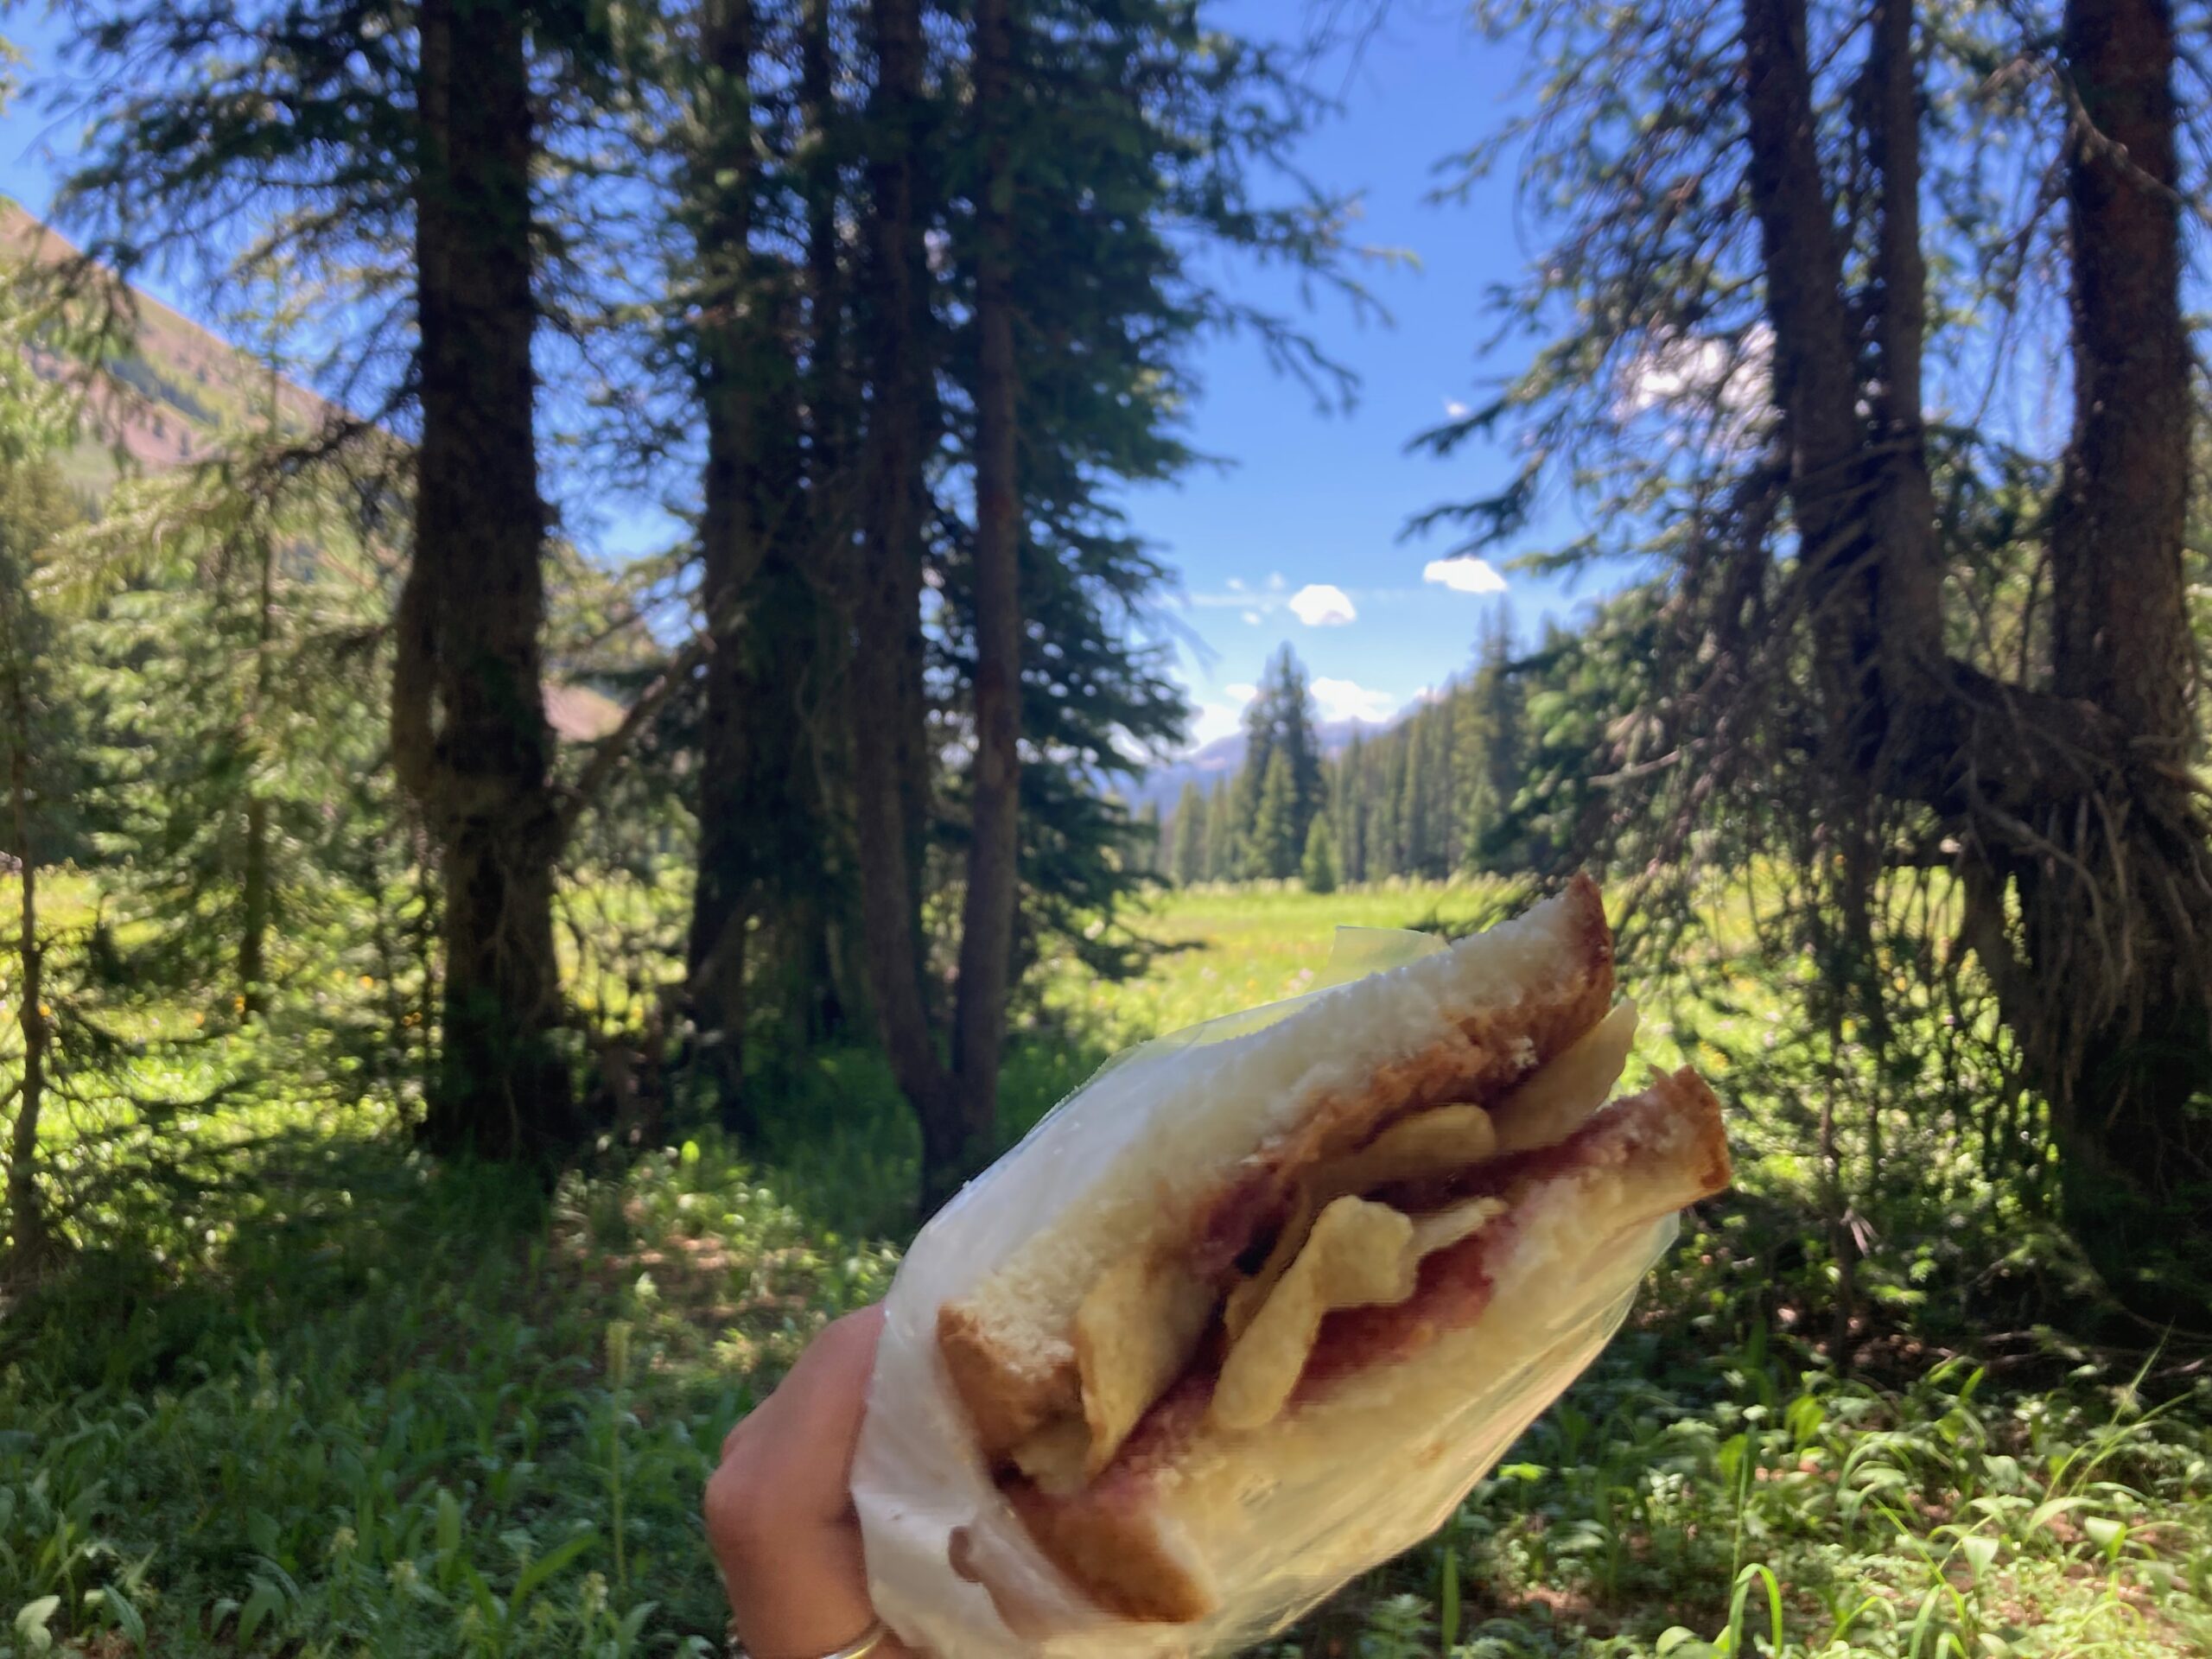
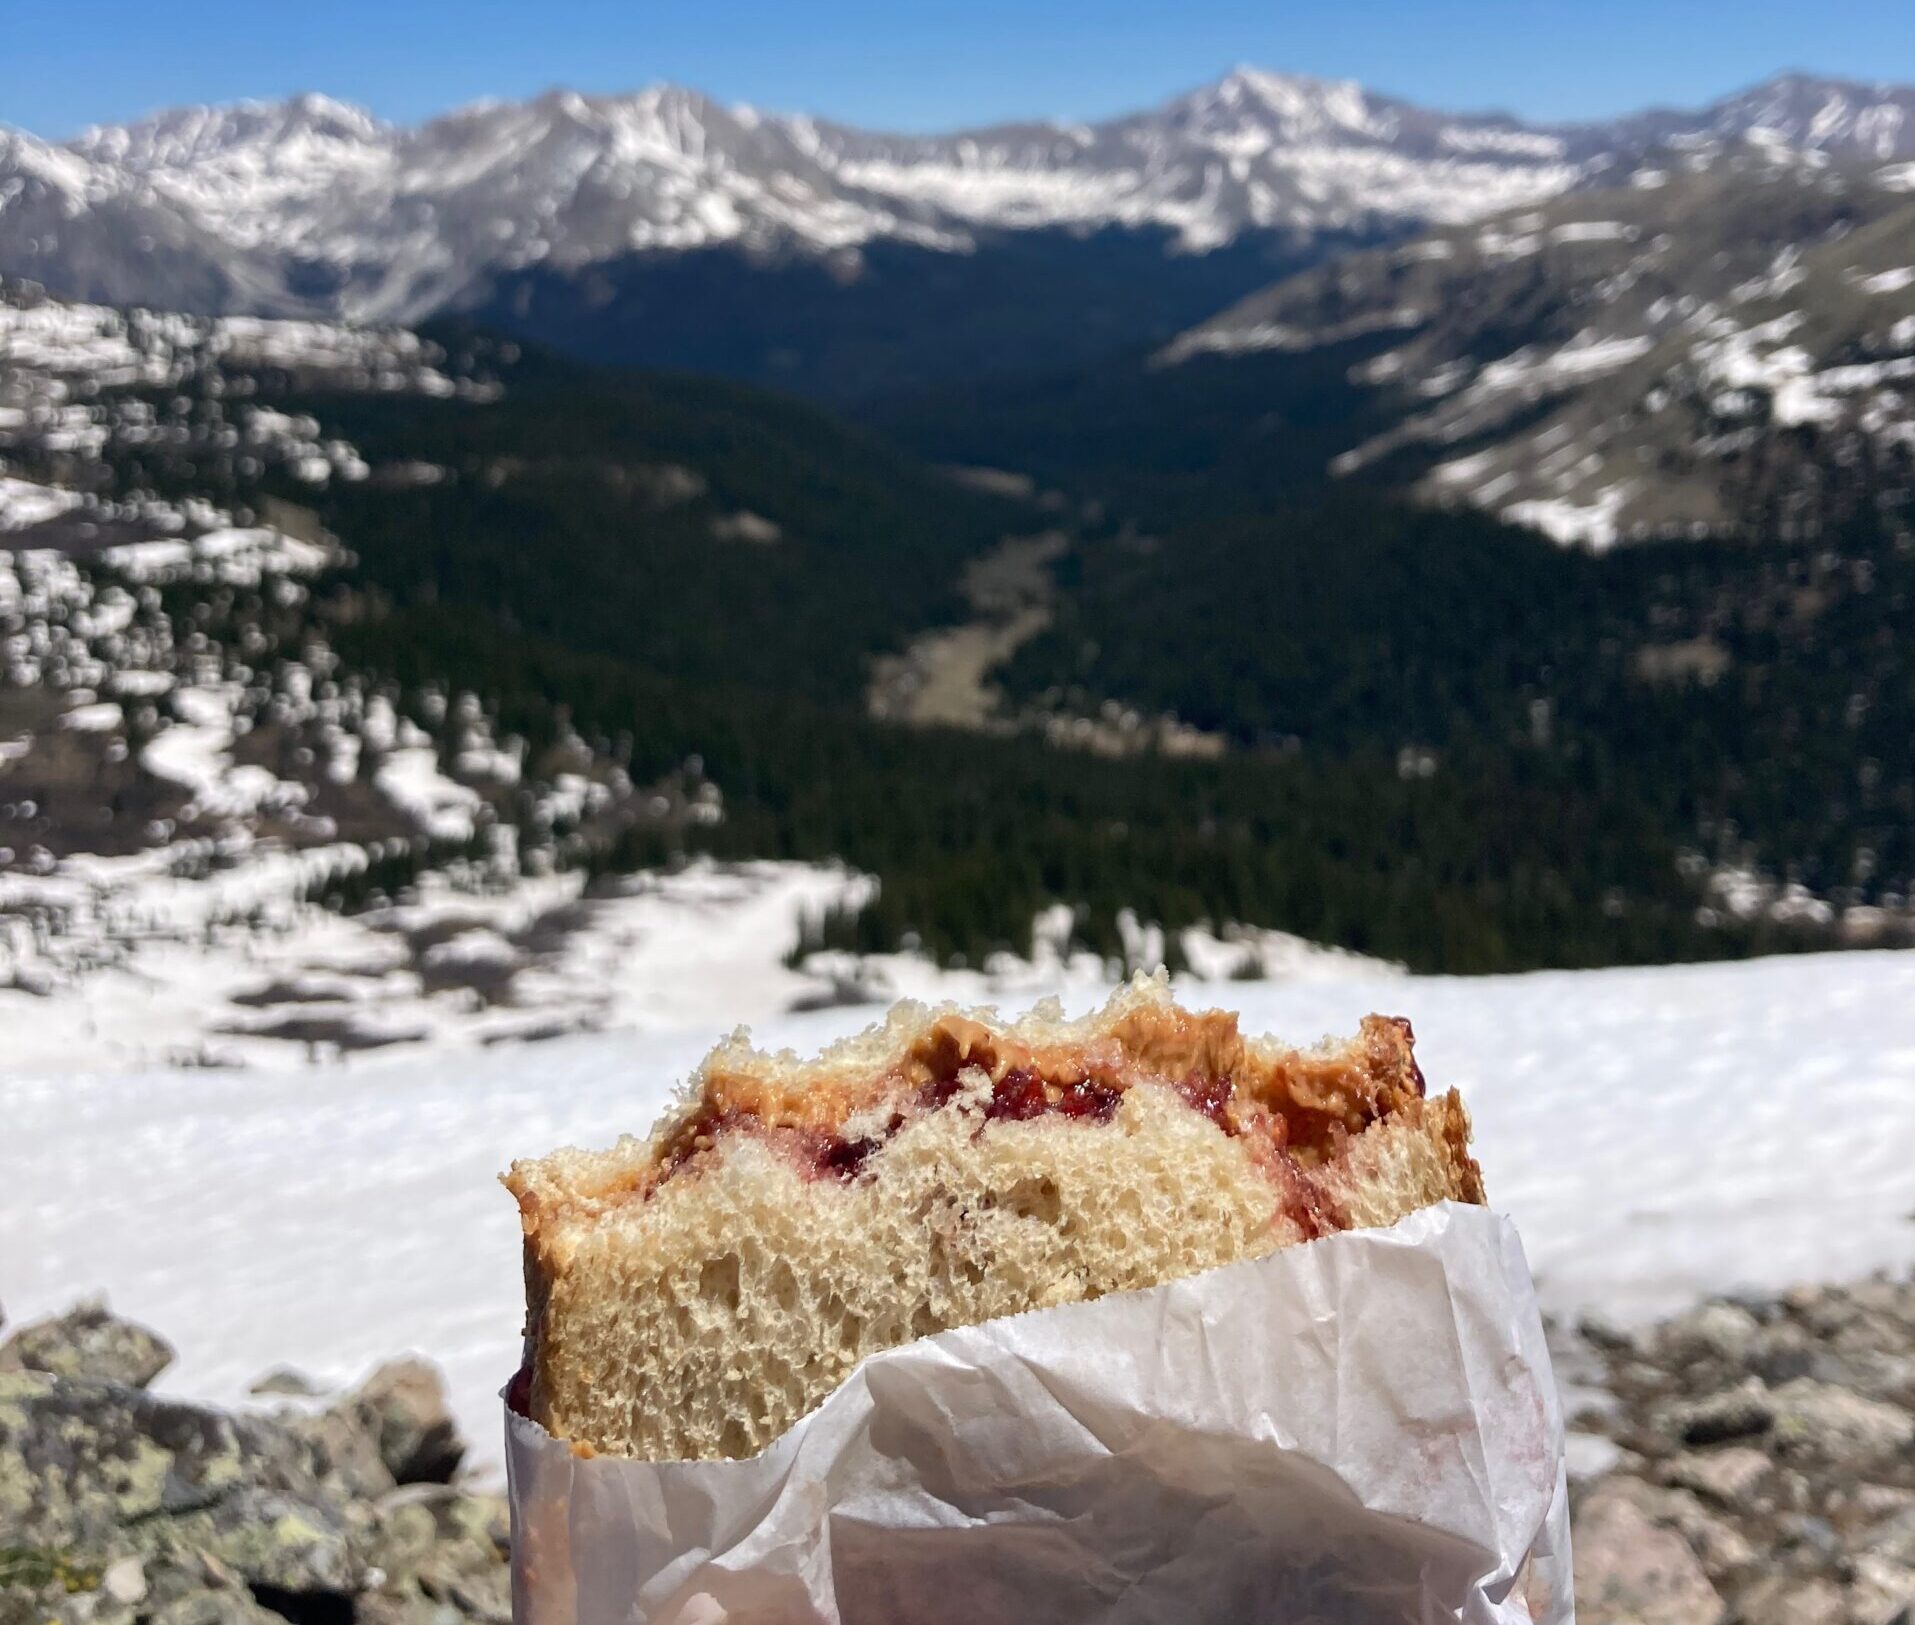
    I can personally attest to the PB&J’s standing as great adventure fuel (all of the photos in this article are from the variety of lunchtime views I’ve shared with a PB&J). It is my go-to for hiking and backpacking trips for a number of reasons: it’s affordable, portable, and customizable. Purchasing the ingredients won’t break the bank, and it doesn’t need to be refrigerated (honestly, I think PB&Js taste even better when they’re a little bit squished…). Additionally, PB&J customization is endless. I personally like to toast the bread or add a layer of plain potato chips to up the crunch factor, but one can also make changes to boost health benefits. Using whole-grain bread, swapping jelly for real fruit slices (banana is particularly delicious), or using natural nut butter are all ways to make the PB&J a little bit healthier.

    Now you know a little bit about the history and science behind a PB&J sandwich, as well as ways to customize it to make it healthier or even more delicious. 


    References

    [1] National Peanut Board. (2023). Who invented peanut butter? Retrieved from https://nationalpeanutboard.org/news/who-invented-peanut-butter/

    [2] National Peanut Board. (2023). Who invented the peanut butter and jelly sandwich? Retrieved from https://nationalpeanutboard.org/news/who-invented-the-peanut-butter-and-jelly-sandwich/

    [3] Dean, S. (2013). History of the PB&J, from spa food to school lunch. Retrieved from https://www.bonappetit.com/entertaining-style/trends-news/article/history-of-the-pbj

    [4] National Peanut Board. (2023). 5 reasons PB&J is the best sandwich ever. Retrieved from https://nationalpeanutboard.org/news/5-reasons-pbj-is-best-sandwich-ever/#:~:text=A%20PB%26J%20has%2015%20grams,of%20energy%20that%20athletes%20need.

    [5] Stylianou, K. S., V. L. Fulgoni III, and O. Jolliet. (2021). Small targeted dietary changes can yield substantial gains for human health and the environment. Nature Food, 2, 616-627.

  • Matcha Magic

    Matcha Magic

    What is matcha? 

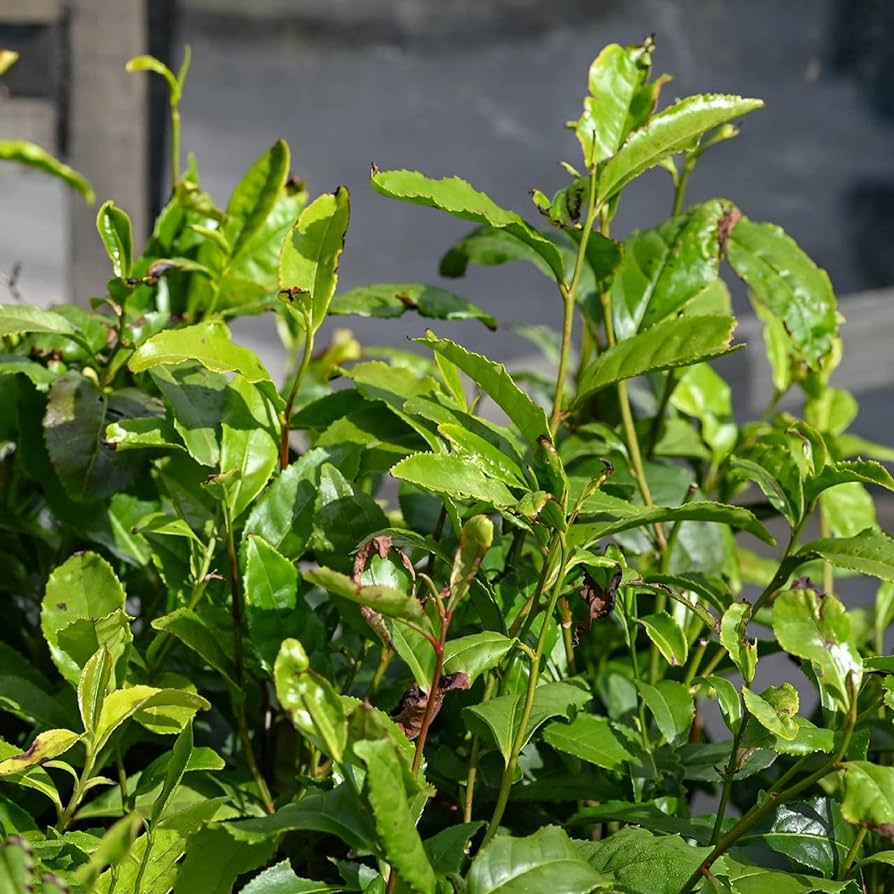
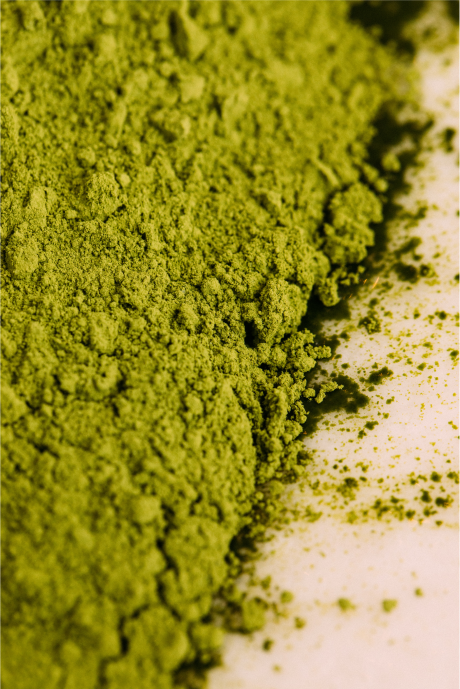
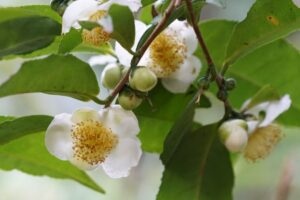
    Matcha is high-grade green tea grounded into powdered form. It comes from the leaves of the Camellia sinensis plant.

    Compared to other teas, matcha is a little quirky, due to the fact that it is shade grown, then steamed or stone ground.

    Shade grown means that it is made from shade-grown tea leaves where tea bushes are proteced from sun and light is filtered in a controlled manor. Shading boosts chlorophyll production, which gives the leaves a richer green color. The lack of sun reduces the plant’s photosynthesis of the leaves, which alters the naturally occurring levels of caffeine, flavanols, sugars, antioxidants, and theanine.

    The leaves are then treated with steam heat within to halt the oxidation process and bring out the color even more. Doing this creates a unique flavor profile of sweet and vegetal.

    Matcha can also be stone ground; this is when the leaves are laid flat to dry and become tencha (leaves from which matcha is made). The tencha leaves are stripped of their stems and venins with the remaining ground in slow-turning mills to yield a smooth green tea powder.

    How do you make matcha?

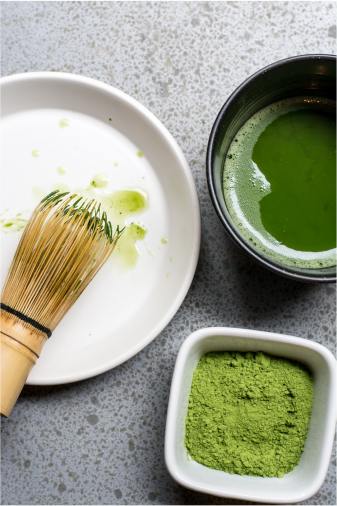
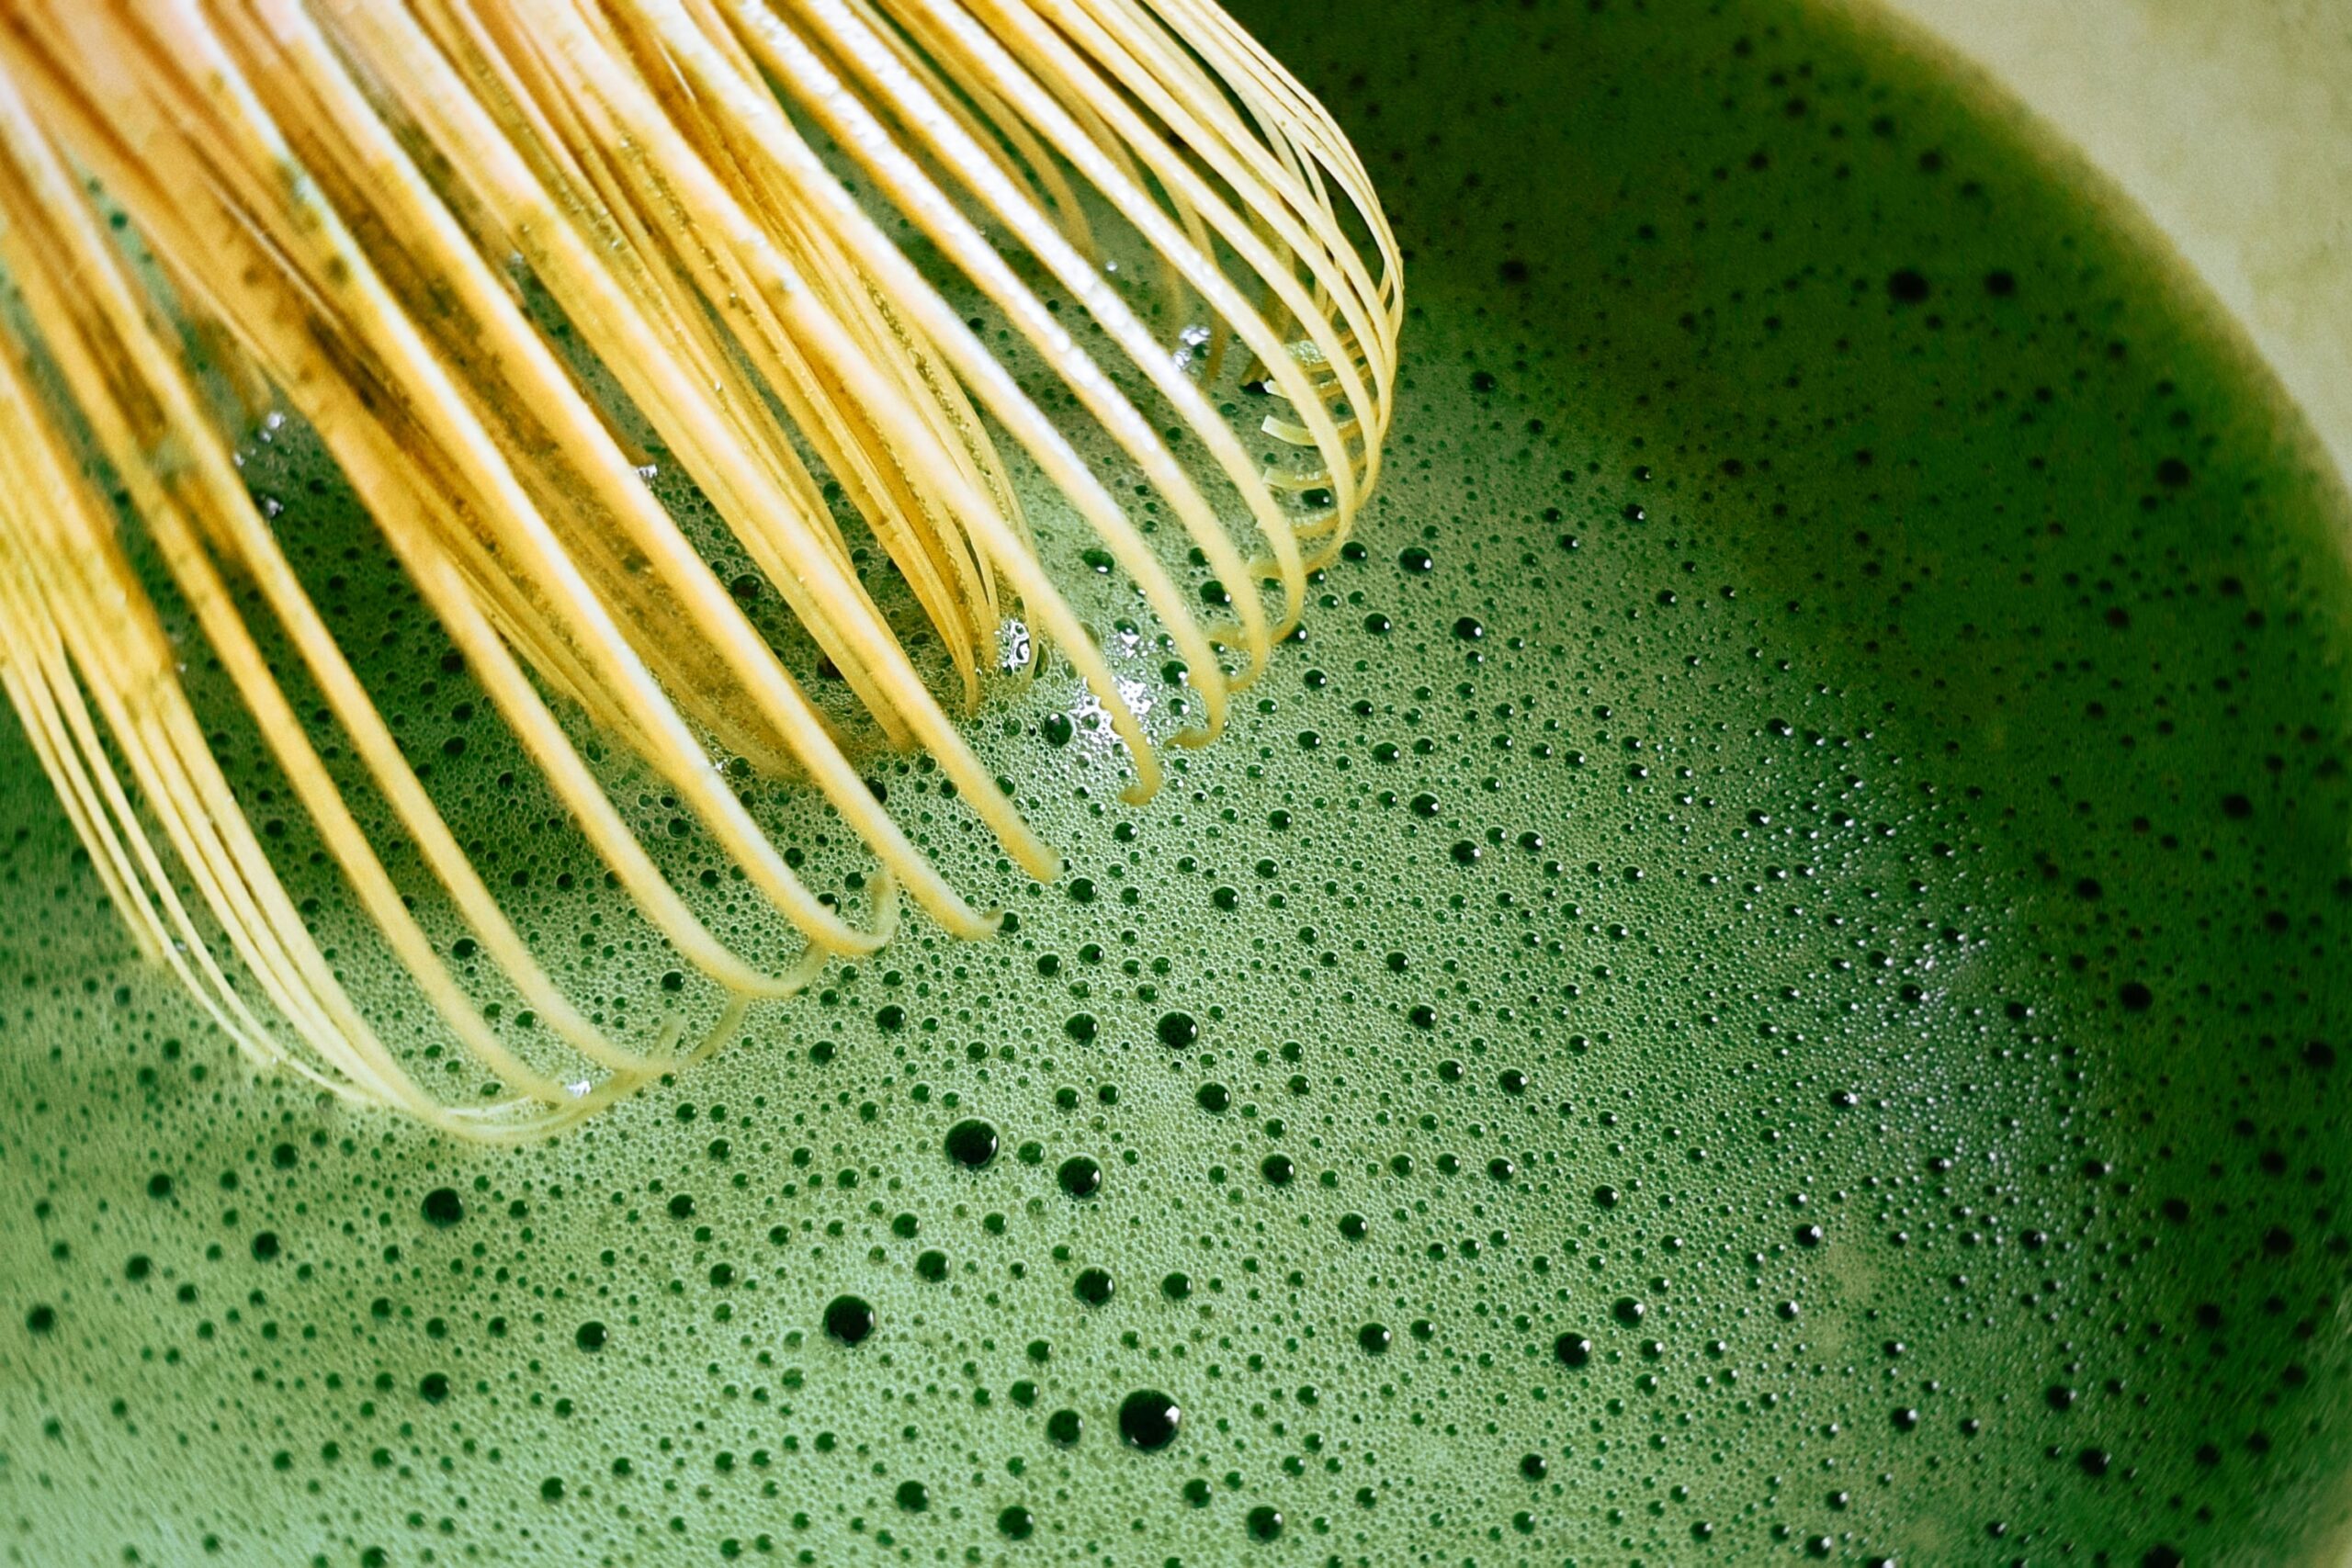
    To make a delicious matcha drink, whisk the powder into hot water to form a frothy drink. Whisking promotes aeration, allowing the matcha powder and water to mix with air to give it a thick head of foam on top. The matcha can be a tea, latte, or even a smoothie!

    Does matcha have caffeine?

    Yes, matcha does have cafeeine! It has less caffeine than brewed coffee, but more than green tea. The tea leaves retain more of their caffeine content. Consuming matcha means you’re consuming the ground tea leaf, which means you’re ingesting more caffeine content than youw ould from the extraction of tea leaves.

    What’s the difference between Green Tea and Matcha?

    Green tea uses brewed tea leaves with a light, grassy flavor. Matcha, on the other hand, is the pulverized version of green tea leaves. It has a stronger concentration of some key nutrients and antioxidants.

    References

    • https://www.teatulia.com/tea-varieties-101/what-is-matcha.html 
    • https://www.medicalnewstoday.com/articles/matcha-vs-green-tea#summary
    • https://www.sugimotousa.com/blog/how-to-whisk-matcha#:~:text=to%20Enjoy%20Matcha-,Why%20Whisk%20Matcha%3F,head%20of%20foam%20on%20top.


  • Stem-Tober 2023 | Cereal or a Rock?

    Stem-Tober 2023 | Cereal or a Rock?

    StemComm’s Fall 2023 event was Stem-tober Block Party! We invited everyone to join us for a fun evening with science-based activities, prizes, and more! We had our event near where the physics students have their annual pumpkin drop. 

    Ideation & Brainstorming: 

    In the ideation process, we split into groups to come up with some ideas for what we wanted our fall event to be. We came up with over 10 ideas. To narrow them, I made a google form that had everyone rank their top 3 choices. After looking at the results, we decided on these activities:

    Group 1: Liquid Nitrogen Ice Cream and dragons Breath Candy

    Group 2: Gene-Tic-Tax

    Group 3: Dragon’s Beard Candy

    Preparation:

    I was part of Group 1, so we got together and discussed what some of the materials were required. We originally wanted to do ice cream, so we made this list:

    • Materials Needed for Ice Cream
      • Liquid Nitrogen from Chem Department
      • Gloves
      • Ice Cream Base
        • Milk (4 cups)
          • Oat milk
        • Sugar (1 cup)
        • Vanilla extract (1 teaspoon)
        • Corn Starch (3 tablespoons plus 2 teaspoons)
      • Metal Bowl (large)
      • Hand mixer

    We quickly decided not to do the liquid nitrogen ice cream and to just focus on the dragons breath candy because it would be easier to make as people came up to our table.

    We had some options as to what we wanted to dip into the liquid nitrogen that would give participants “dragon breath.” We were thinking of dipping cereal, so we requested to order large spherical cereal, but it wasn’t going to come on time, so we ordered regular Fruit Loops and marshmallows instead. We also ordered bamboo skewers and contacted a professor to get access to liquid nitrogen canisters. 

    The last thing we had to get ready was our poster. We had a poster designed on Figma with a fun dragon and fire visual. We also had some more informational posters that would describe what liquid nitrogen was and how we were using it in our experiment demonstration. 

    Day of the Event:

    Before the event, I went to the library to print out the poster. After, I met up with all the StemComm people near the Howey building where our event was taking place and helped set up the table, liquid nitrogen setup, and posters. It was a little slow in the beginning, some people who came up to our table were just students passing by, or people who were trickling in for the Pumpkin Drop event. Soon, more people pulled up to our event and we were dipping cereal in liquid nitrogen to give to as many people as we could. 

    It was really fun to see people’s reactions to the texture, taste, and density of the liquid nitrogen-dipped cereal. After trying it myself, I found the cereal to be almost the same density as a rock. It was tougher to bite on and made a really big crunch sound. 

    If I could change one thing about what we did for the event, it would be make it more apparent that the usage of liquid nitrogen can be hazardous and to partake in our activity at your own risk.

  • Cracking the Code: The Towers of Hanoi

    Cracking the Code: The Towers of Hanoi

    Now that we have developed a fundamental understanding of how different counting systems, especially binary, work, we can begin to understand the optimal solution to the Towers of Hanoi.

    One by One 

    Because binary digits are restricted to just one of two values, counting in binary has a particularly interesting rhythm. Understanding this rhythm is crucial in solving the Towers of Hanoi problem. This online binary counter is particularly useful in visualizing this rhythm. Beginning from zero, continue to count up, adding one with each step. Keep track of the index of the value that switches to a 1 at each step:

    0, 1, 0, 2, 0, 1, 0, 3, 0, 1, 0, 2, 0, 1, 0, 4, …

    Solution to the Towers of Hanoi

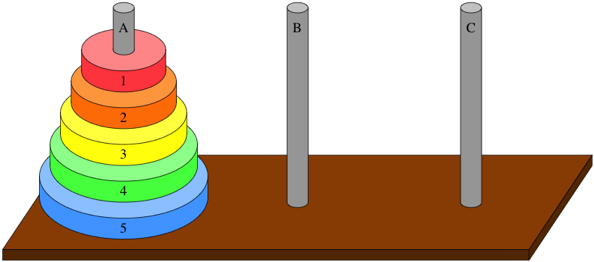
    Interestingly enough, the most optimal solution to the Towers of Hanoi comes from following this rhythm exactly. To tie the two together, first assign numeric indices to the disks: 0 is the smallest, 1 the next smallest, and so on. Then, simply follow the pattern, at each step moving the disk whose index matches the next number in the sequence.

    For example, consider the 3 disk problem:

    • 0: move disk 0 to the right peg
    • 1: move disk 1 to the middle peg
    • 0: move disk 0 to the middle peg
    • 2: move disk 2 to the right peg
    • 0: move disk 0 to the left peg
    • 1: move disk 1 to the right peg
    • 0: move disk 0 to the right peg

    And then we are done! There are some beautiful symmetries to this pattern. Also interesting is the fact that, for a setup with n disks, the optimal solution requires exactly 2^n – 1 moves.

    Why Does This Work?

    In so few words: recursion! Both the rhythm of binary counting and the problem of the Towers of Hanoi are self-similar problems. The idea of self-similarity ties directly into recursion: the full process, whether that’s counting up to a certain number or solving a problem with a certain number of disks, involves completing a smaller version of the process.

    In the Towers of Hanoi, consider again the 3 disk problem. If we were somehow able to move the stack of the 2 smallest disks as a single unit, then the problem would reduce to three steps:

    1. Move the 2-disk unit off of the third disk
    2. Move the third desk to the right peg
    3. More the 2-disk unit onto the third disk

    So, through a recursive approach, the problem becomes much simpler to solve.

    In the process of binary counting, return to the counter visualizer. Count up to the number 7 (111 in binary). Notice that we count up to the number 3 (11 in binary), roll over to 4 (100 in binary), and then count up three more to get to 7 (111). This exactly mirrors the recursive pattern in the Towers of Hanoi!

    Conclusion

    Oftentimes in mathematics, and in problem solving in general, finding an inventive way to connect and reduce one problem to another can make understanding optimal solutions much easier. The Towers of Hanoi, though it may appear as a confusing game at first, cleanly works in parallel to just counting up by one in binary. 

    References

    1. https://www.khanacademy.org/computing/computer-science/algorithms/towers-of-hanoi/a/towers-of-hanoi
    2. https://www.mathsisfun.com/games/towerofhanoi.html
    3. https://www.youtube.com/watch?v=2SUvWfNJSsM
  • A day in the life of a field ecologist

    A day in the life of a field ecologist

    Details from my summer experience conducting fieldwork in the Colorado Rockies

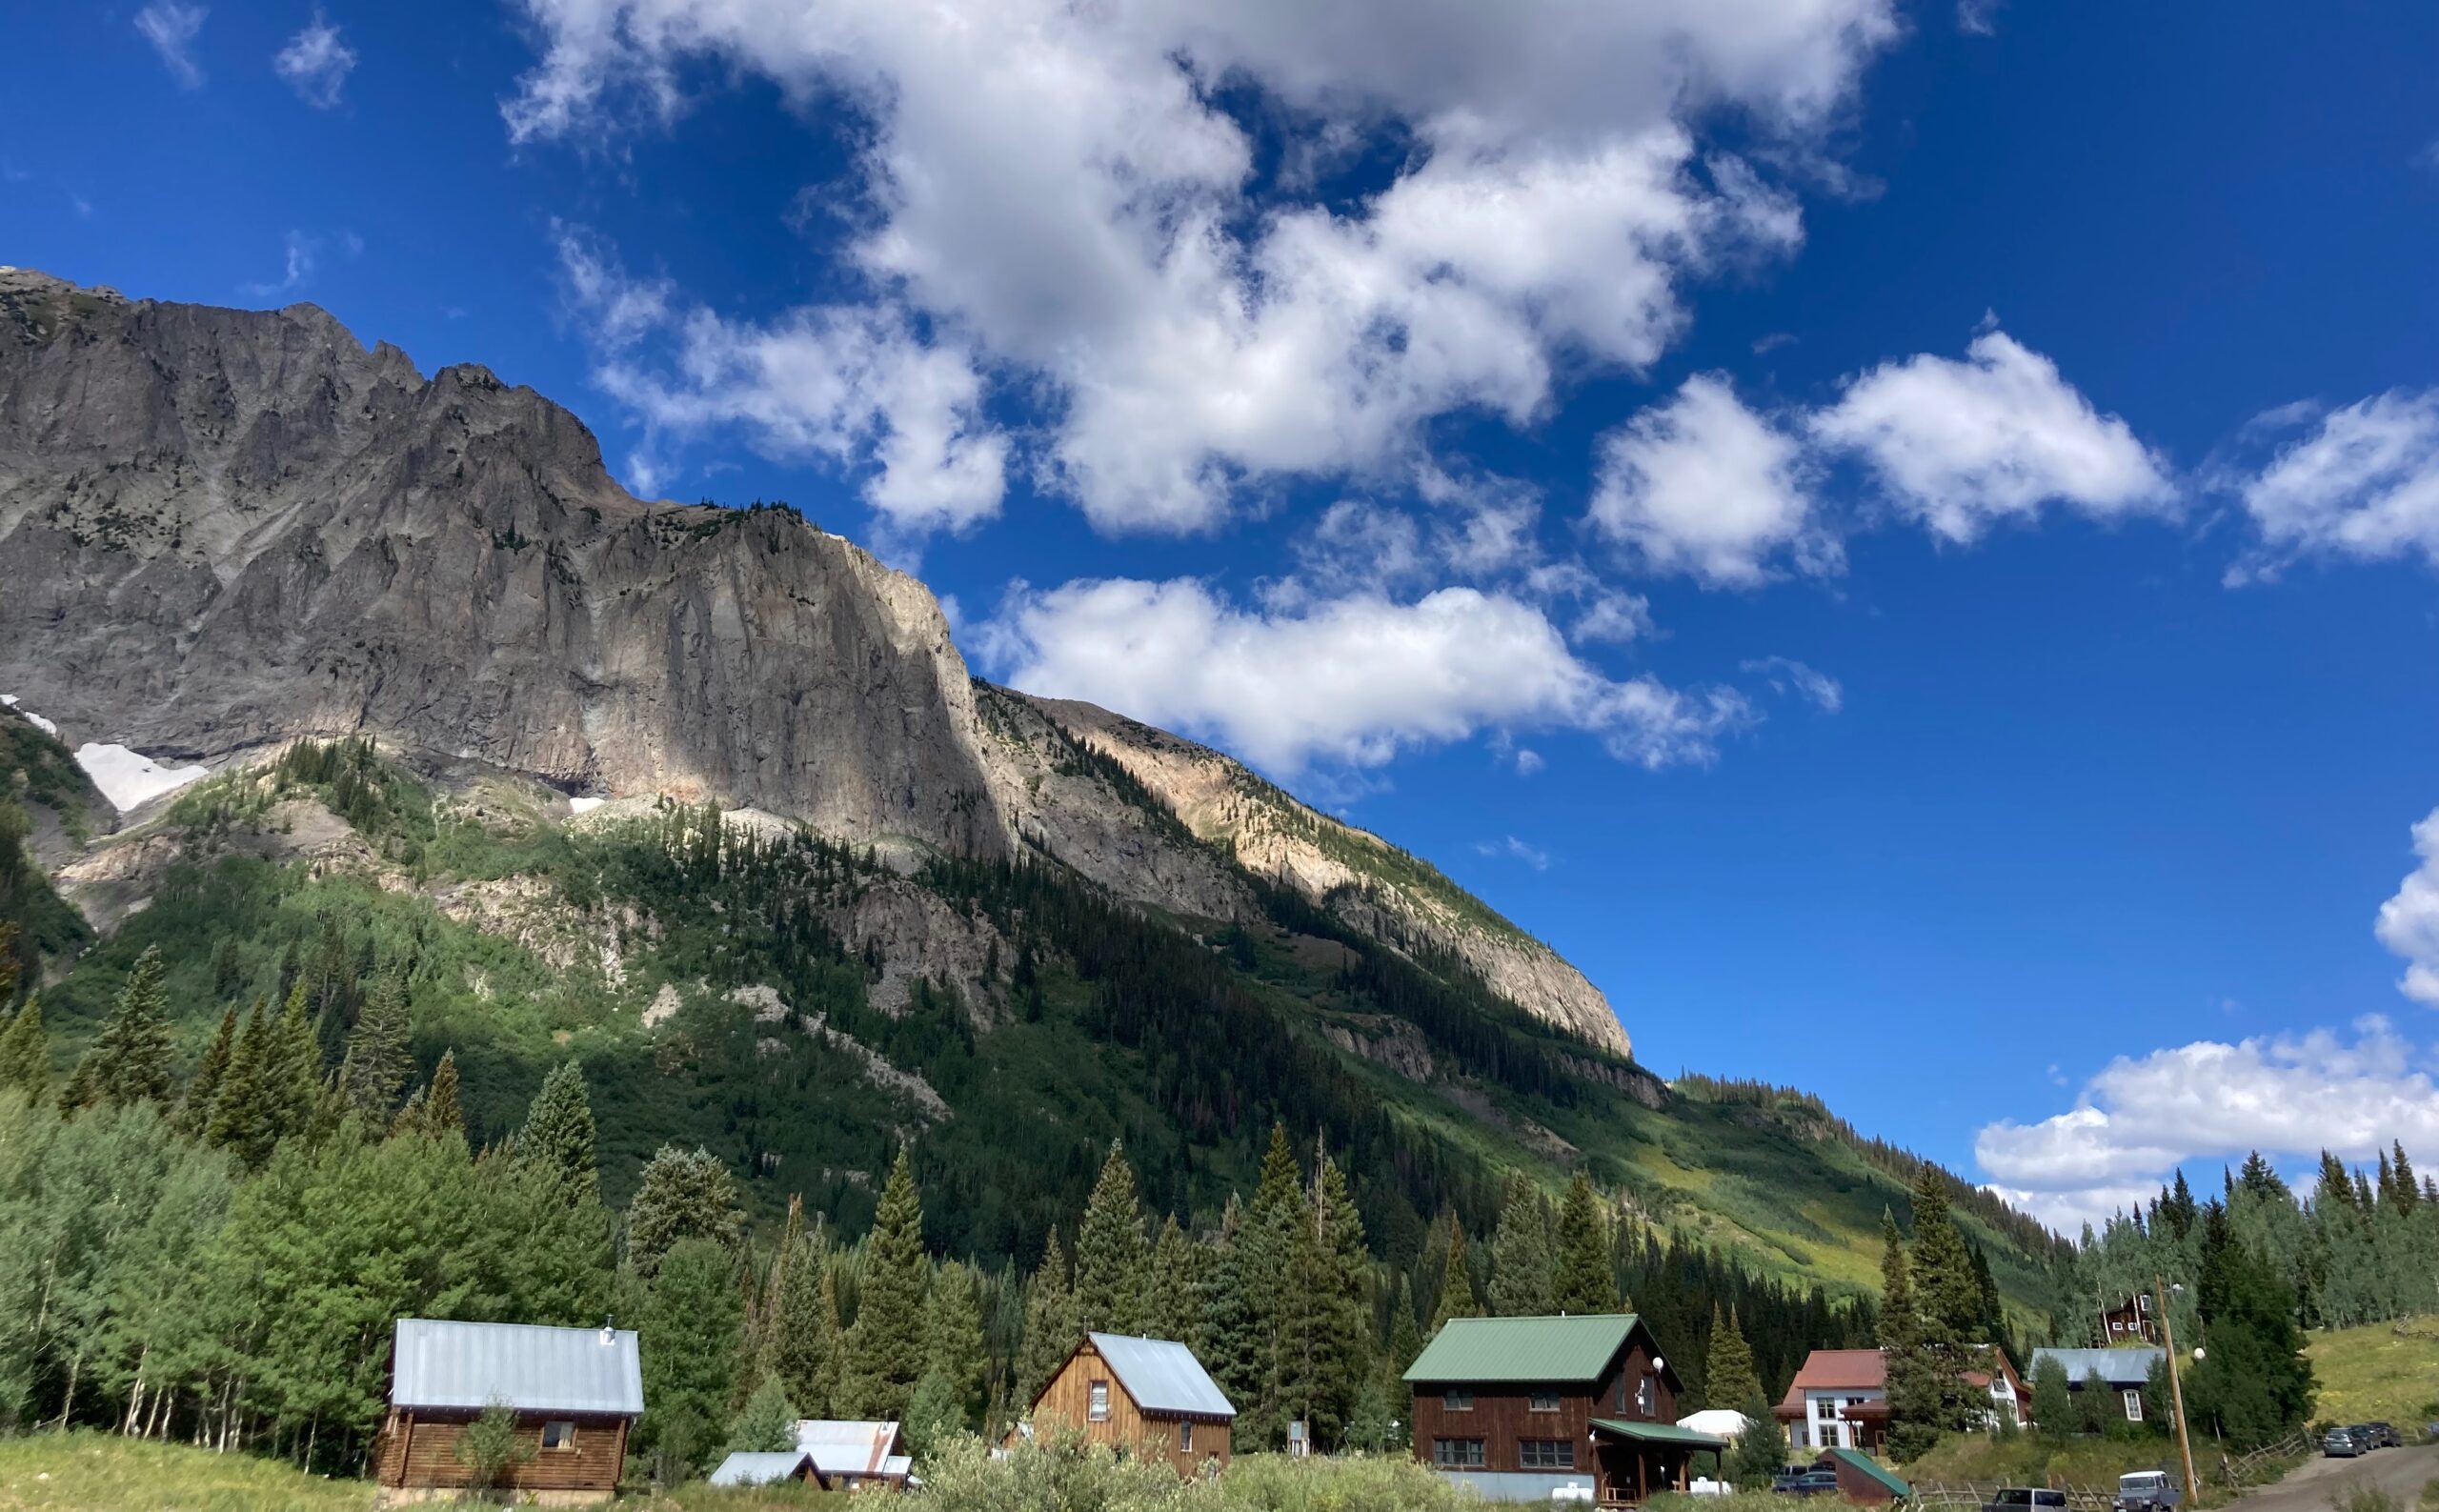
    Photo caption: View of the Rocky Mountain Biological Laboratory, with Gothic Mountain towering above.

    4:30 AM: Good morning! To arrive at my research sites in time to start my bird species surveys by 6 AM, I often have to wake up long before the sun rises. I get dressed, refill my water bottles, collect the snacks and PB&J sandwiches I prepared the night before, and grab my pack. Inside my pack I have my binoculars, data collection sheets, a handheld GPS unit, and of course a first aid kit and extra warm layers. Field research requires that you always be prepared for the unexpected!

    This summer I am investigating how birds in the southern Rocky Mountains are responding to climate change. To do this, I am conducting a resurvey of bird species along an elevational gradient. I have six research sites ranging from 8,100-11,200ft in elevation, and I will visit each site three times throughout the season to conduct a point count survey of bird species. A point count survey involves standing in one spot for a specific amount of time and recording all bird species I observe by sight or sound. Another student conducted these surveys in 2011, so I am repeating their methods to be able to compare the data from 2011 and 2023 and examine how bird communities have changed over the 12-year period.

    6:00 AM: After biking 3 miles along a gravel road to the base of Snodgrass Mountain and hiking another 3 miles up the slope (including a break halfway to enjoy my PB&J for breakfast), I am ready to begin the point counts. I use the GPS unit to locate the coordinates of each survey point, and record all of the species that I hear and see during a five-minute period. These surveys require me to be very familiar with the songs and calls of bird species in the region, as the majority of my detections are auditory. I audio record all of my point counts so that I can go back and verify observations later if I am not certain about my real-time identification in the field. 

    8:00 AM: After I finish the point counts, I sit down to eat a snack and enjoy the beautiful views around me. I begin my bike ride down the mountain, whizzing through fields full of blooming wildflowers.

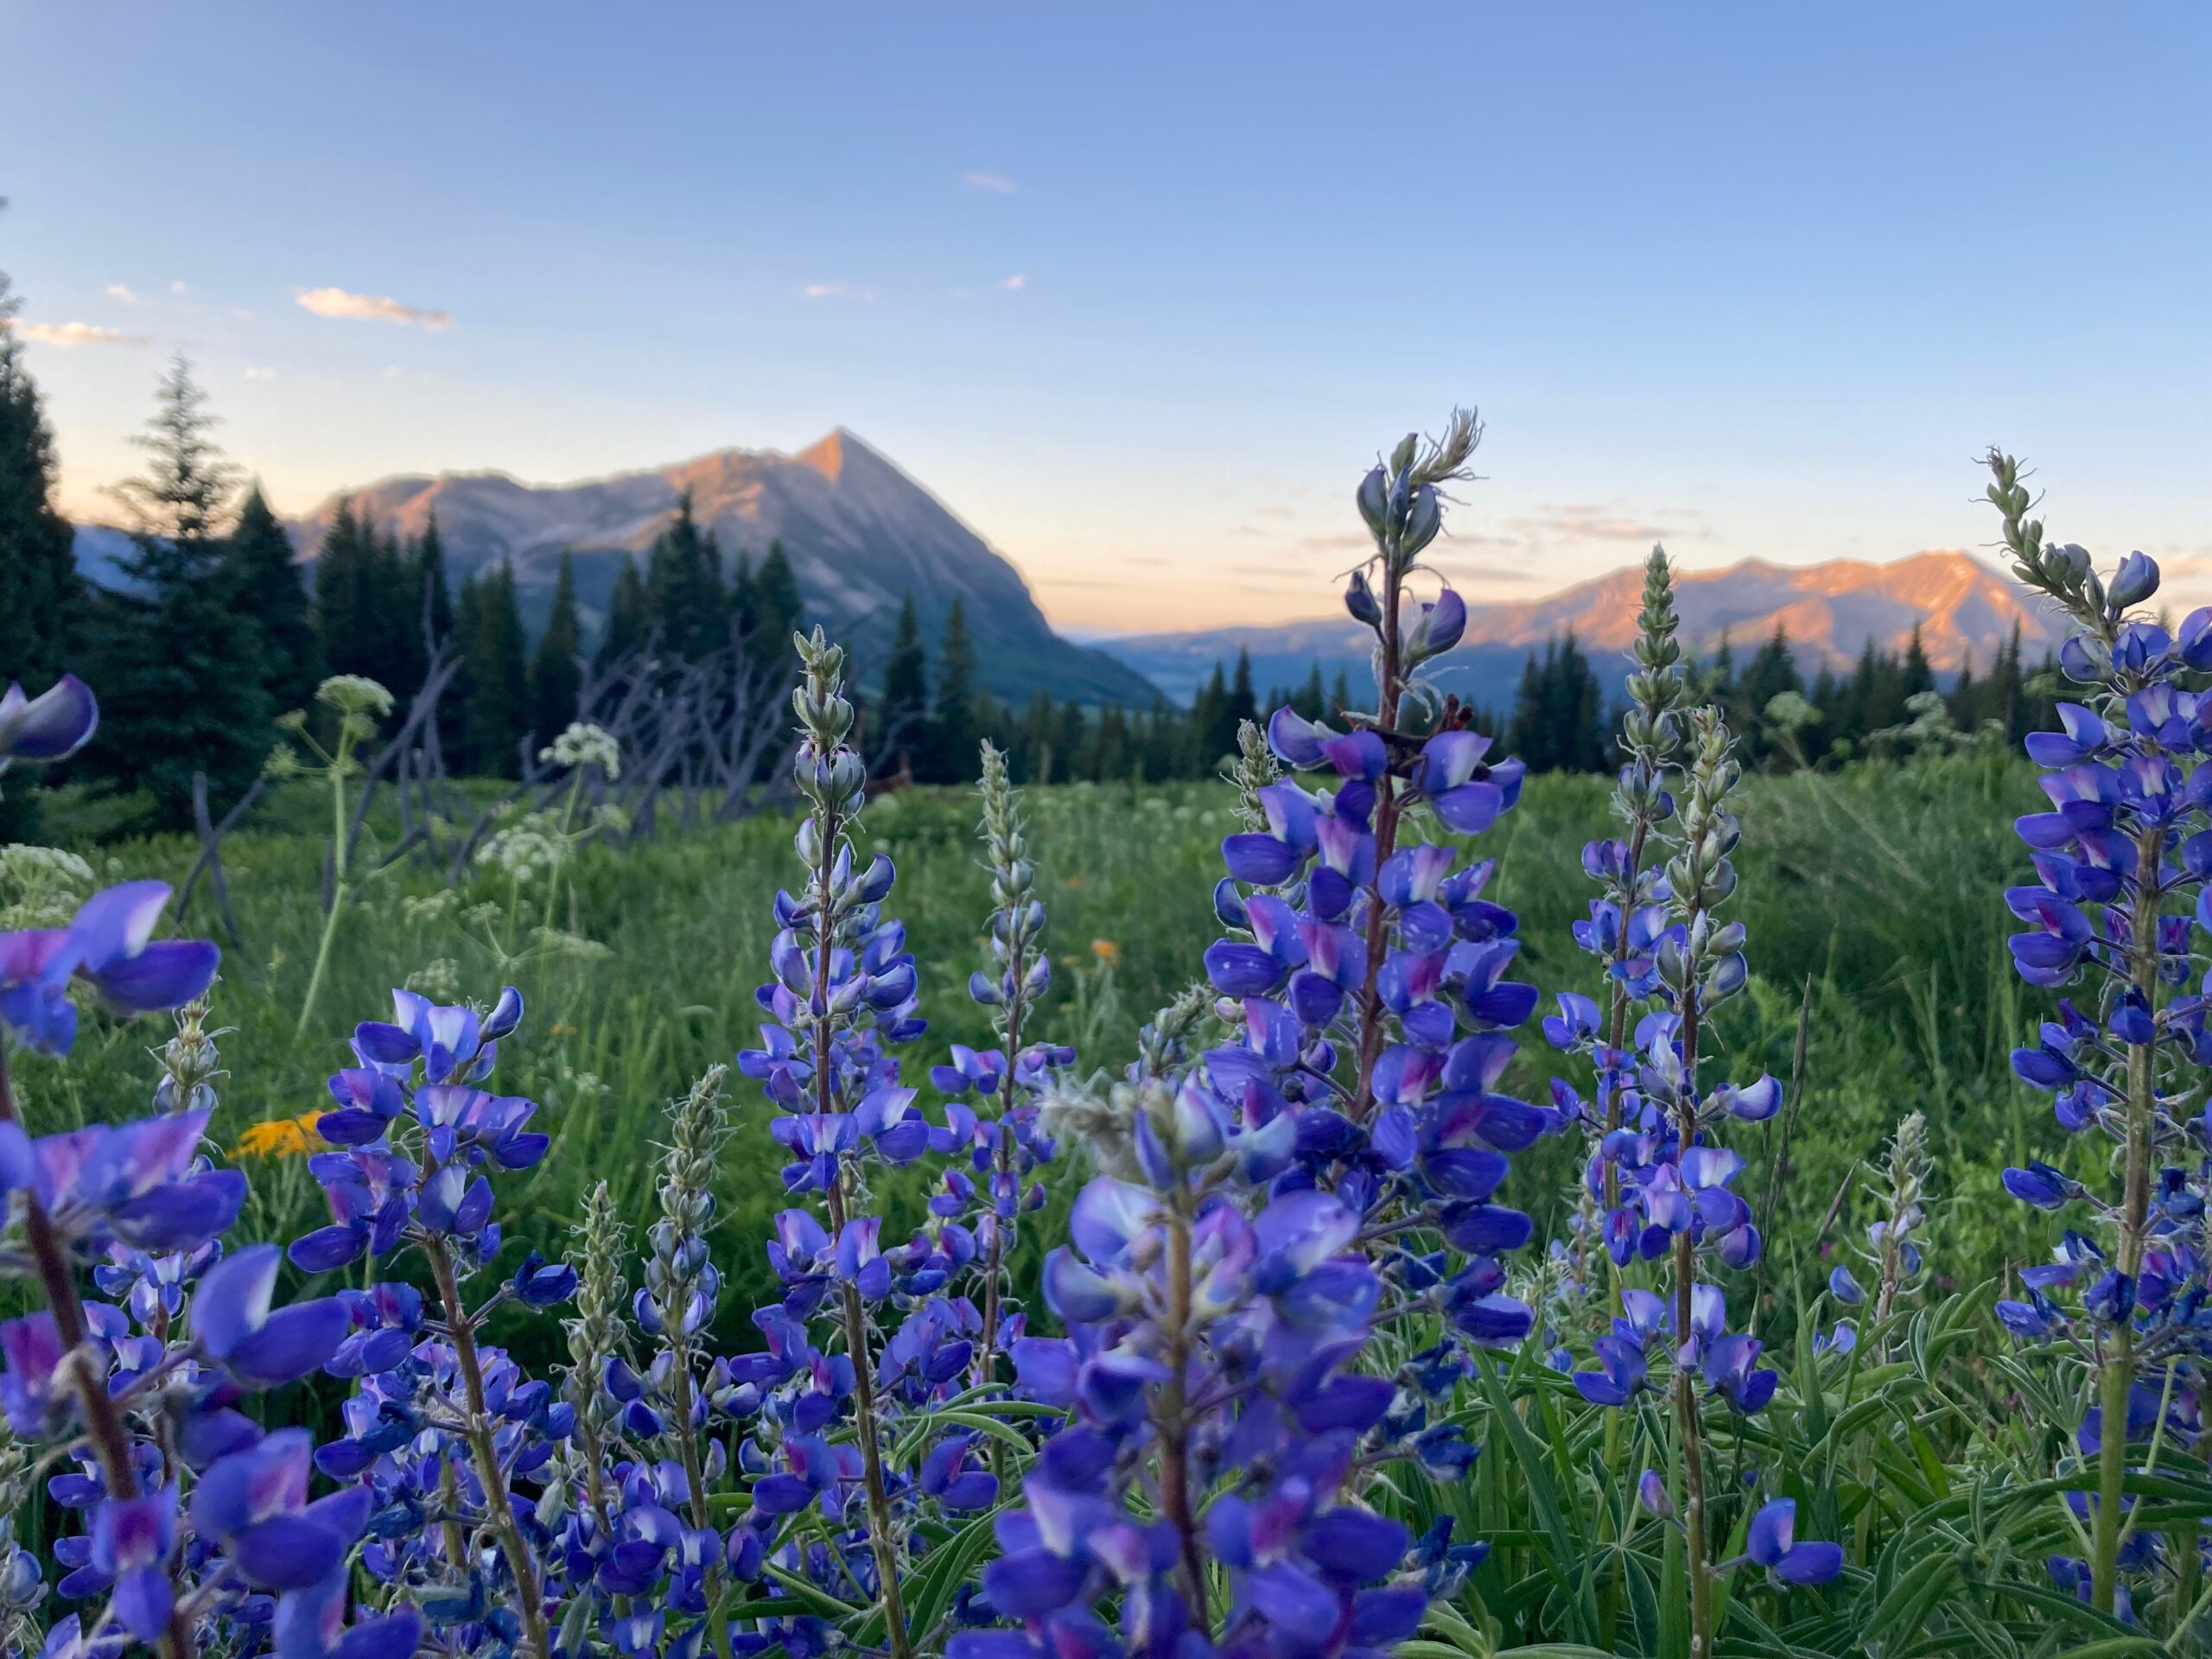
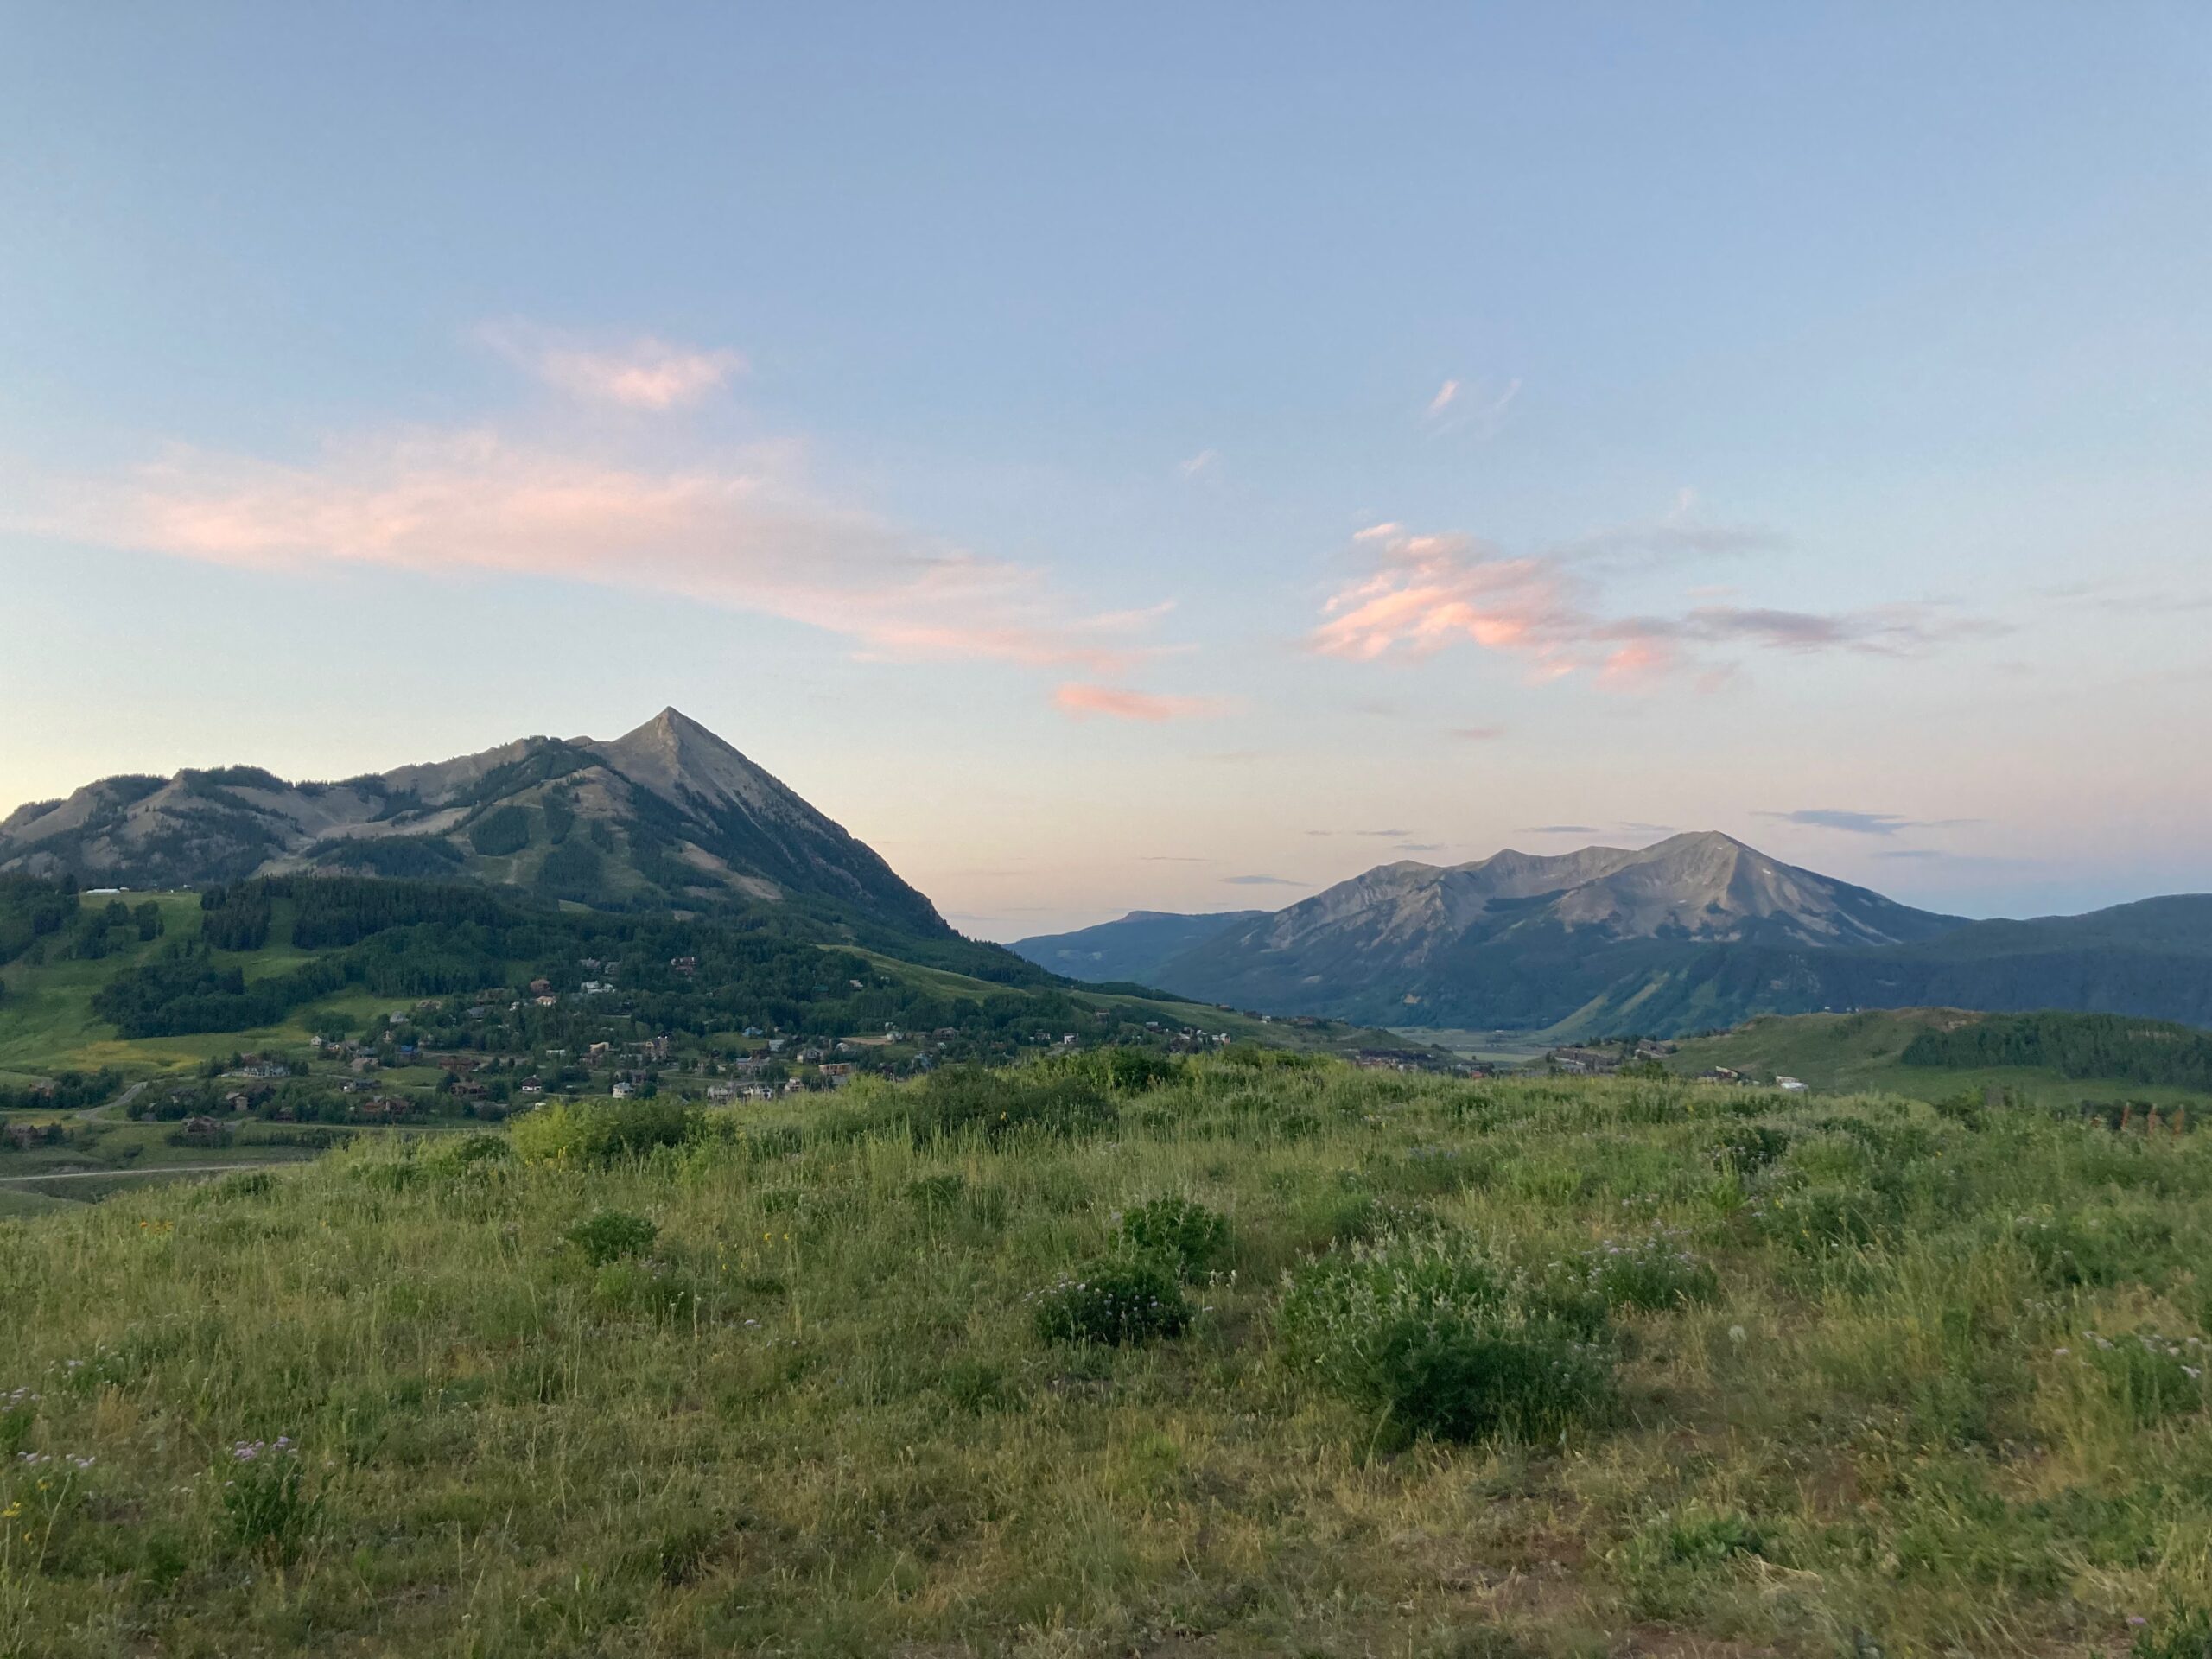
    Photo caption: Views of the sunrise and wildflowers from my trek up Snodgrass Mountain.

    9:30 AM: I make it back to my home for the summer: the Rocky Mountain Biological Laboratory (RMBL), a thriving community of almost 200 field biologists, each studying one component within the greater ecosystem of the southern Rocky Mountains, united with the goal of recording long-term ecosystem responses to climate change. I head to the dining hall to grab more snacks and refill my water—field work can be exhausting and it’s especially important to stay hydrated.

    10:00 AM: I head back to my cabin to enter my point count data from the morning. This involves transcribing my handwritten field notes on paper datasheets into a spreadsheet on my laptop. This is important for multiple reasons: it serves as a backup in case my paper datasheets are lost or damaged, and formatting an electronic file is the first step to performing statistical analyses to uncover trends and relationships in one’s data.

    11:00 AM: Now it’s naptime! With a wake-up call before sunrise, I almost always need a nap to recharge after morning fieldwork. 

    12:00 PM: I nap until lunchtime, and then I head down to the dining hall. RMBL has a great kitchen staff that makes sure the researchers are well fueled for their fieldwork, and the dining hall is a perfect place to meet other scientists and learn about all of the cool research taking place.

    1:00 PM: After lunch, I take some time to look over my research report draft and make some edits to the methods section because a couple of aspects have changed since I began my surveys out in the field. Keeping good records on the methods used for surveys and experiments is very important because it ensures future researchers will be able to reproduce the experiments.

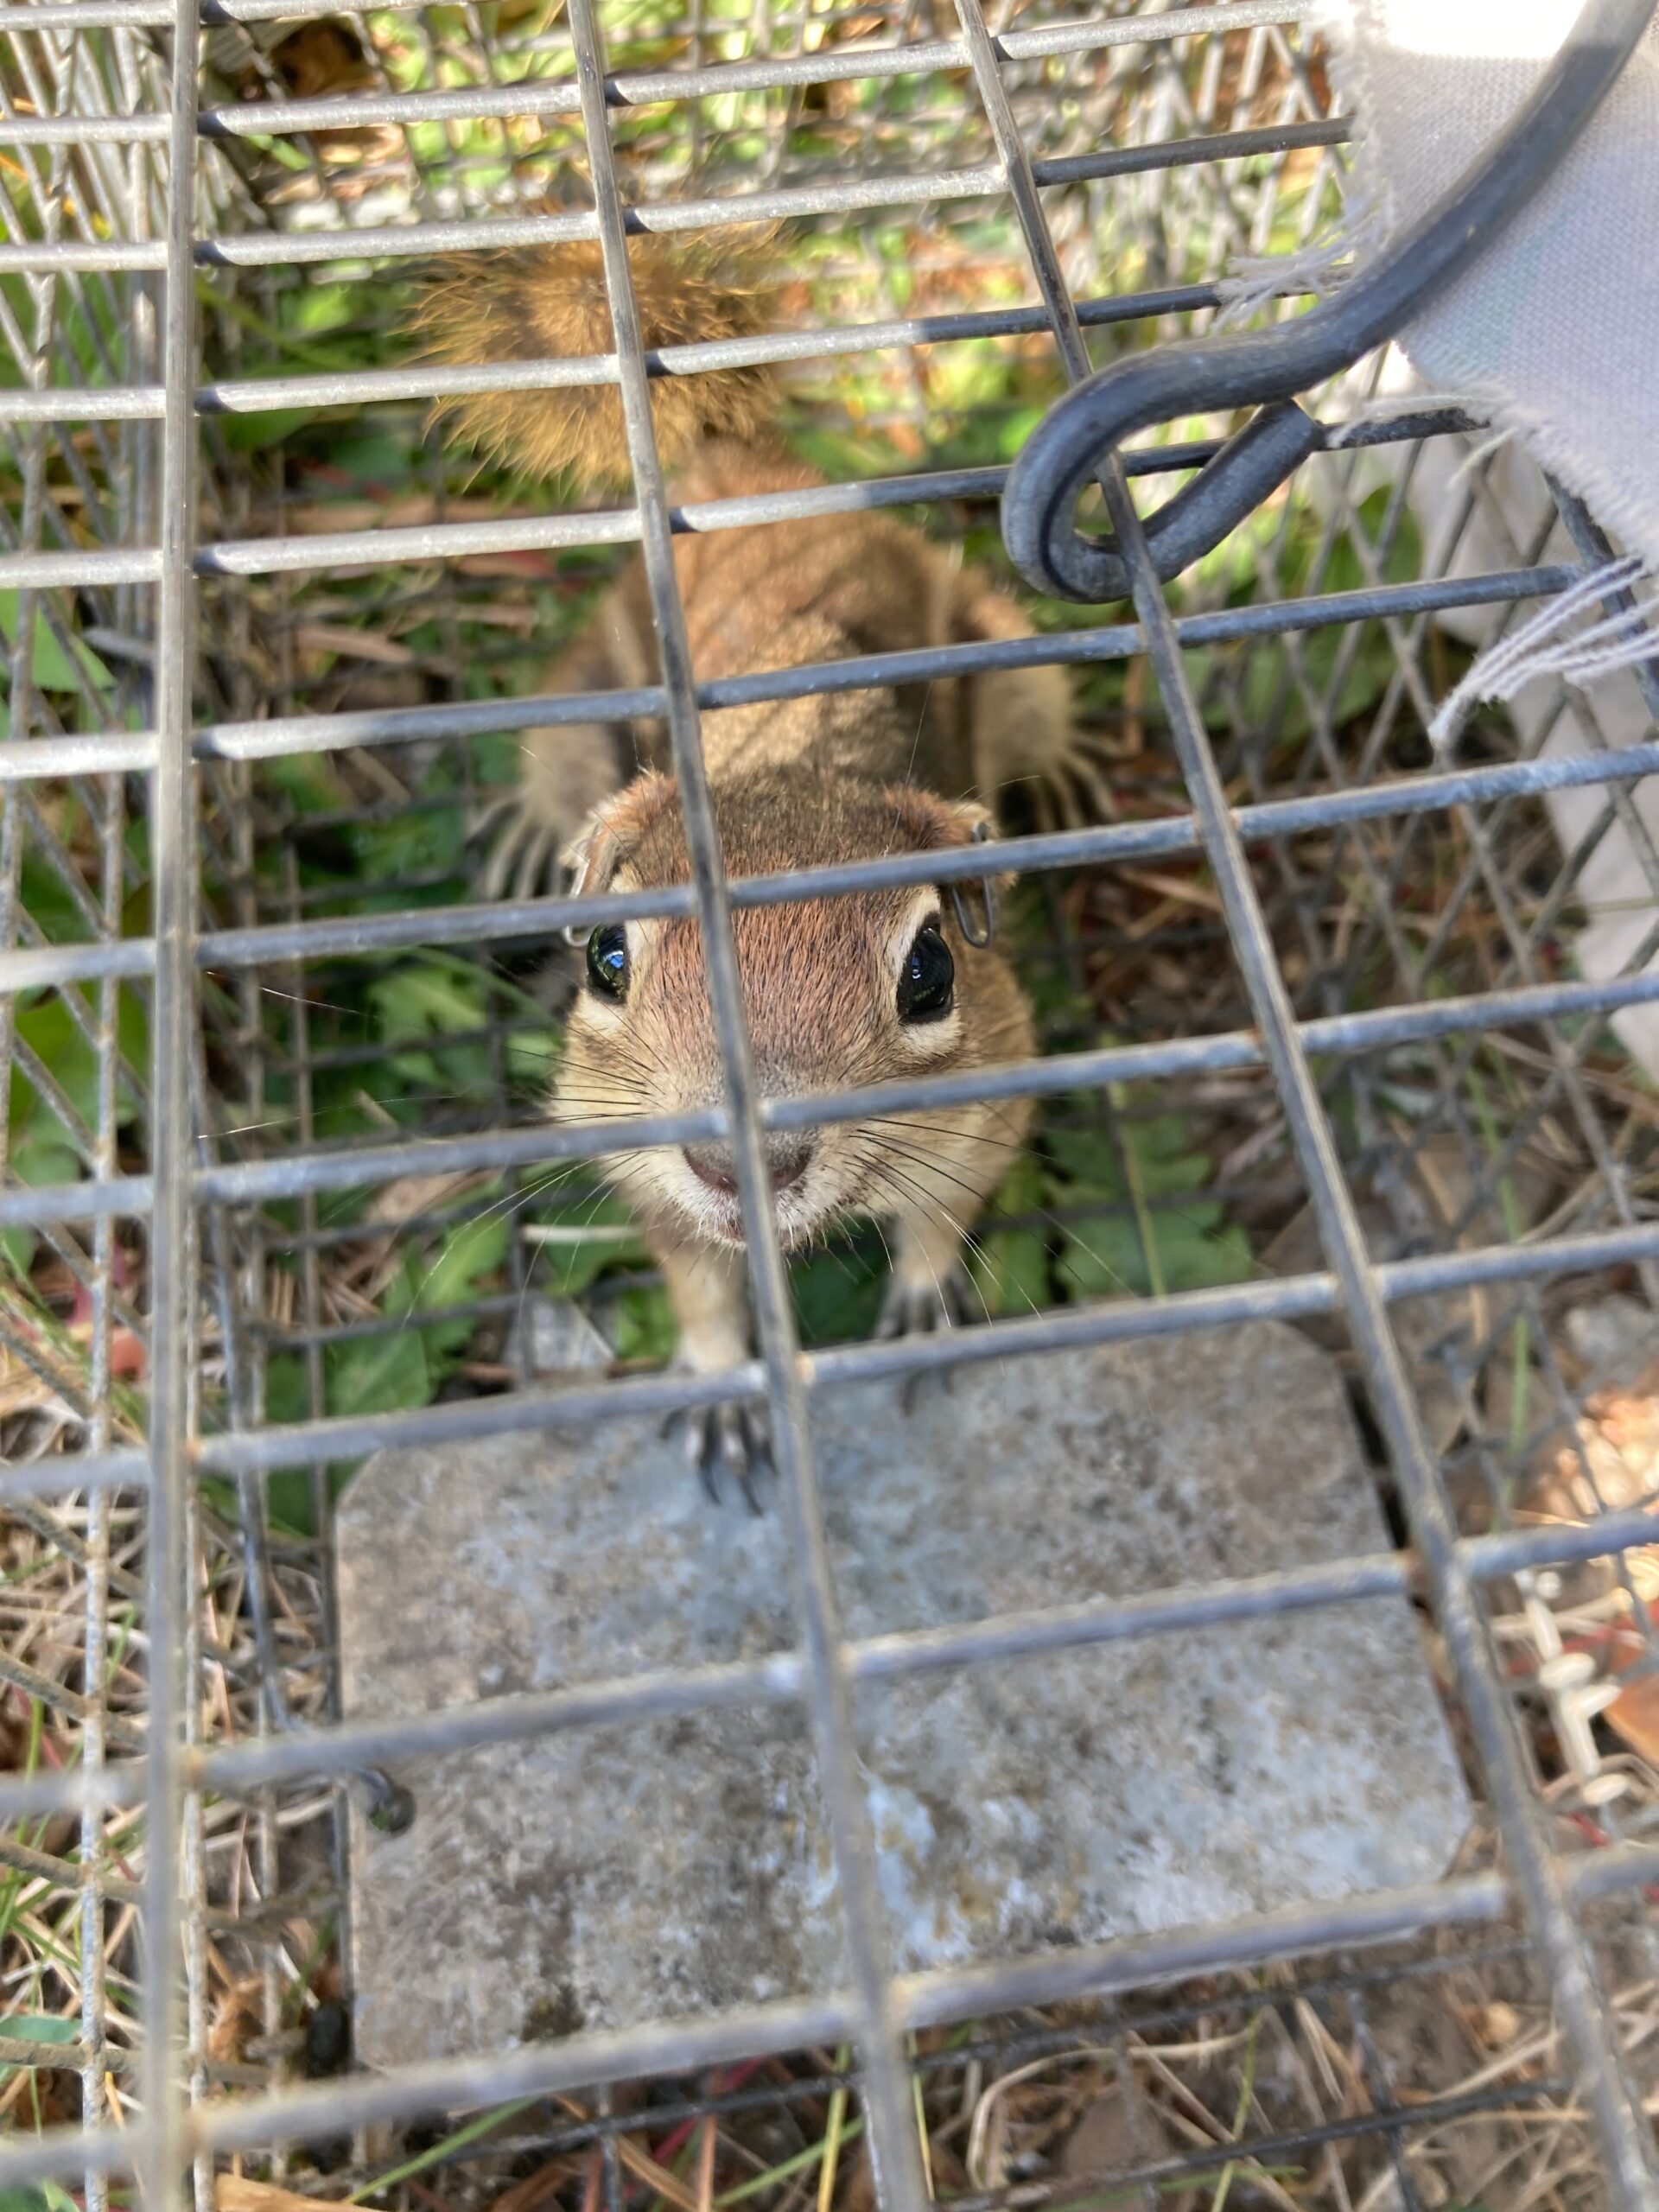
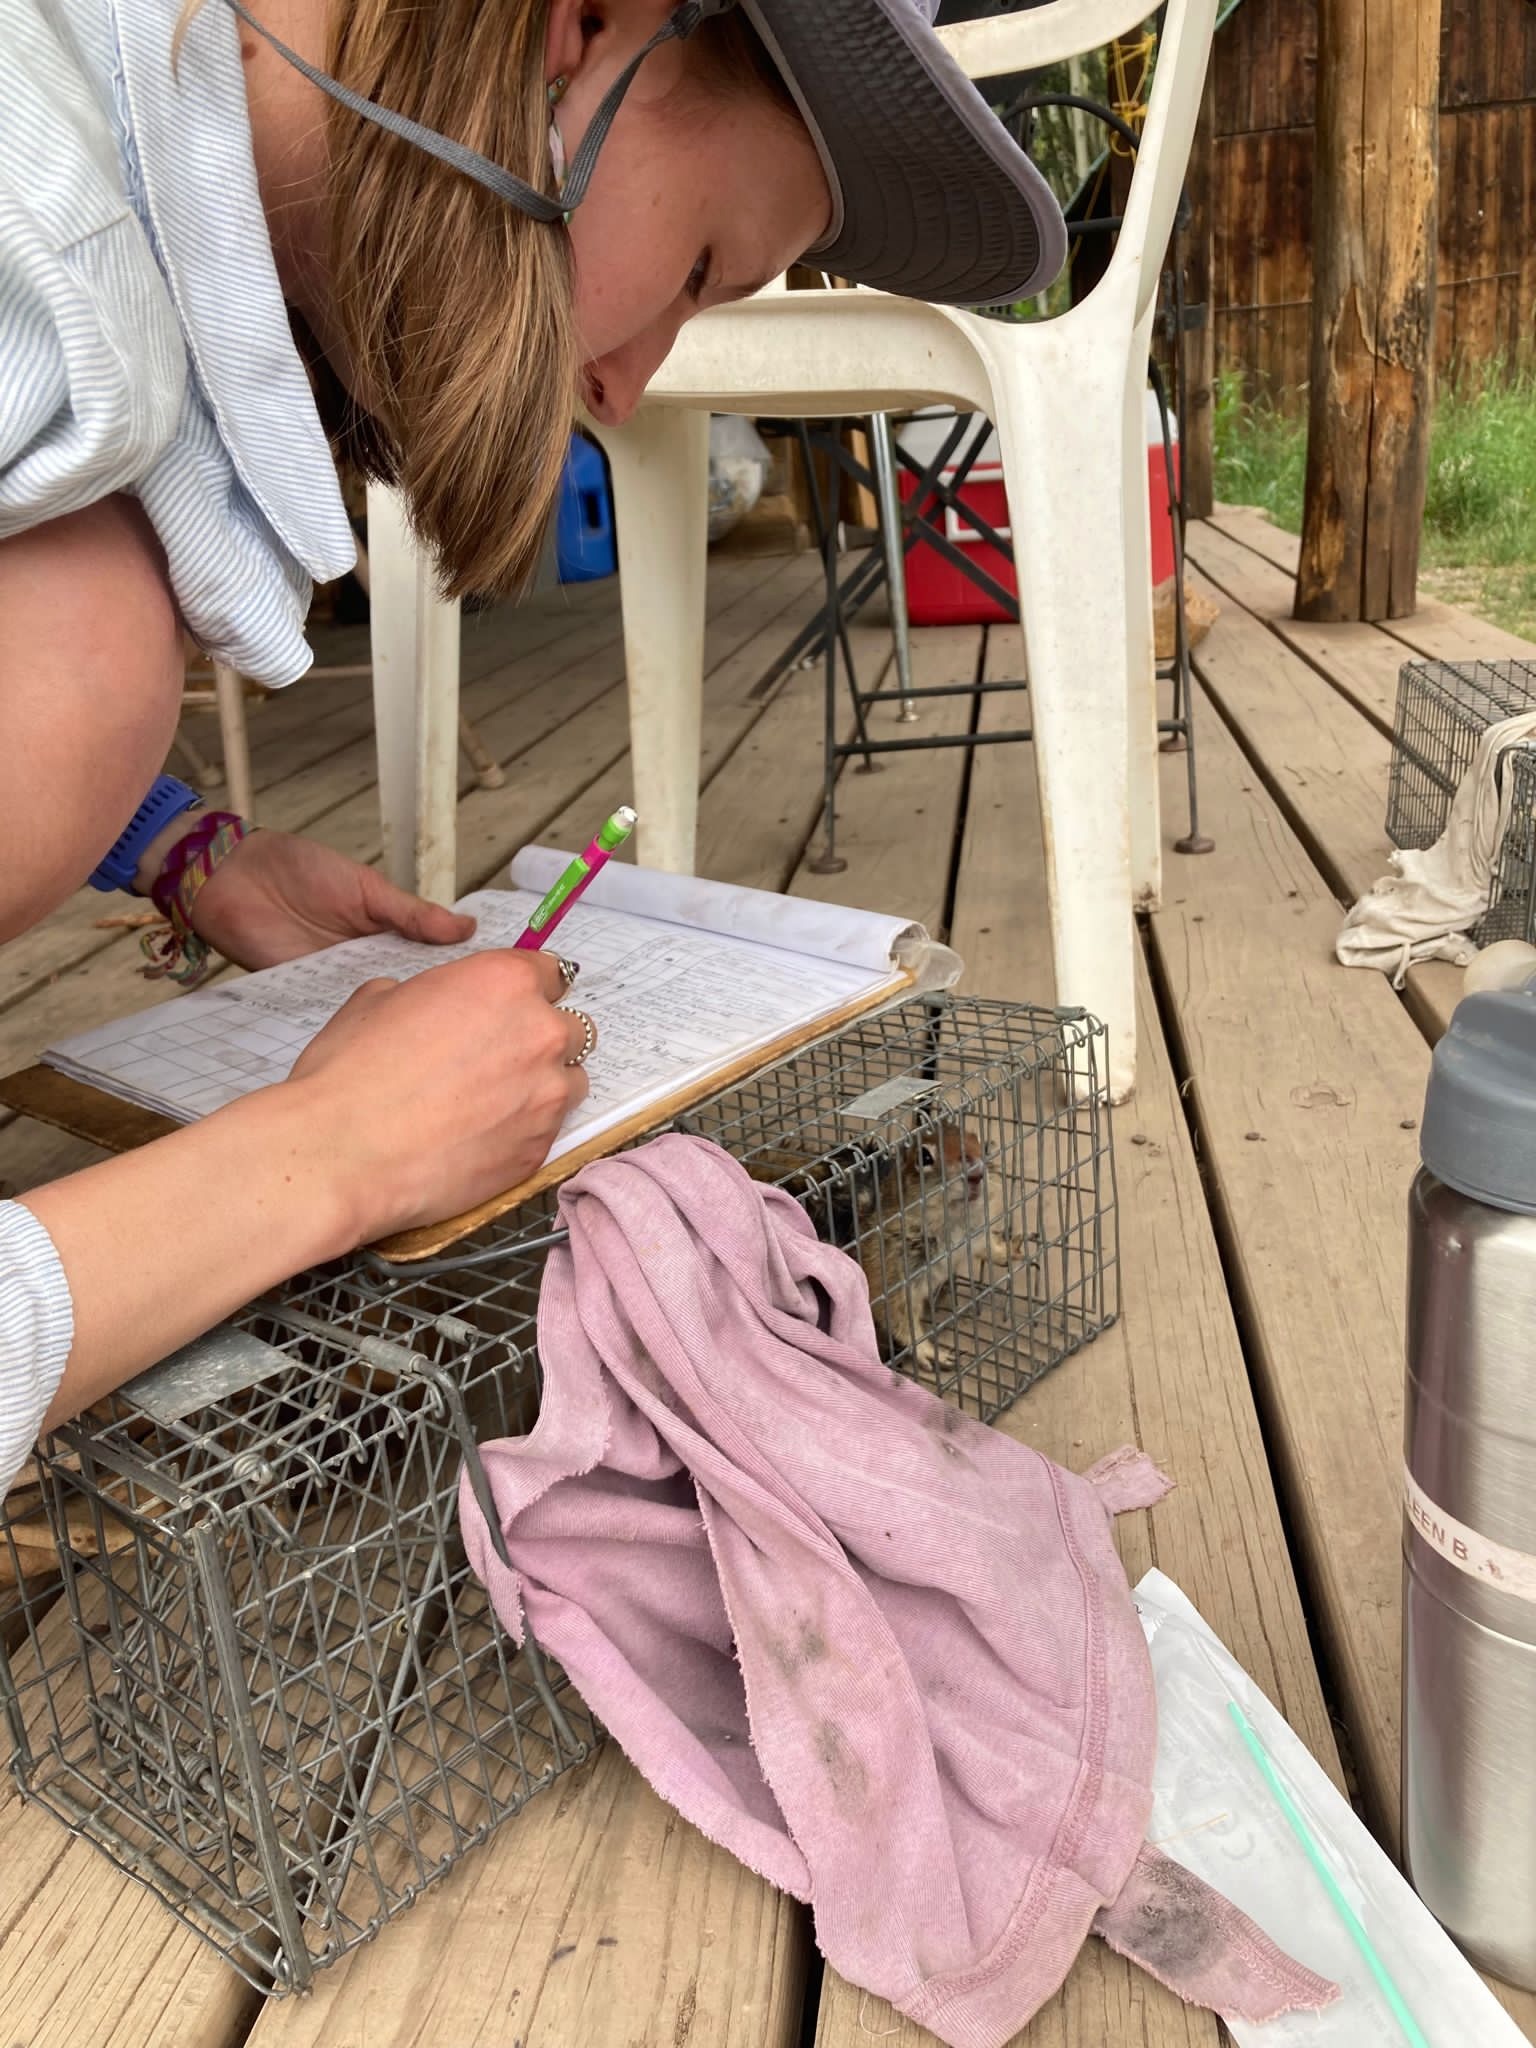
    2:00 PM: Most afternoons, I work as part of the golden-mantled ground squirrel (GMGS) team on a long-term behavioral and spatial ecology project. This involves making rounds around the RMBL townsite looking for squirrels and recording their behavior in 10-minute periods. GMGS resemble chipmunks, but they are larger and can run faster. Another big component of the squirrel project is live trapping, where we bait small wire traps with peanut butter and place them around known squirrel territories. When we capture a squirrel, we put them into a special canvas bag for safe handling and we record morphological measurements such as weight and take hair samples for genetic analysis. The most exciting time is mid-summer when the squirrel pups emerge from their burrows. We try to trap pups every couple of weeks to monitor their growth.

    From left to right: A GMGS inside a trap, data collection during GMGS trapping.

    5:00 PM: After my shift with the squirrel team, I head back to my cabin to rest and relax until dinner. I also must pack up my camping gear, because the site I am surveying tomorrow morning is several miles up the valley from the field station, and it requires an overnight backpacking trip to get there. I pack a sleeping bag, sleeping pad, small 2-person tent, extra layers, water filter, and my survey equipment in a backpacking pack. At the dining hall during dinner, I will grab extra snacks and make a couple of PB&Js to carry with me. 

    7:00PM: After dinner, myself and two of my fellow student researchers borrow a vehicle to drive to the beginning of the hiking trail that will take us to the research site. We park next to a beautiful alpine lake and begin the 3-mile hike. We will gain 1500 ft in elevation over the course of the hike, so the majority of the trail is unrelentlessly steep. The gorgeous views of the sunset over the mountains around us serve as a good distraction from the strenuous hike. Two miles into the hike, we reach a river crossing. We take off our hiking boots and socks and roll up our pants to wade through the ice-cold water. Once across the river, we know there’s only a mile left to climb, and the sunlight is fading fast so we push onwards to try and make it to the site before dark.

    Once we get to the site, which consists of a series of ponds located along a rocky mountain slope, we quickly set up our tents and get ready for bed. The stars are incredible here—we can even see the outline of the milky way.

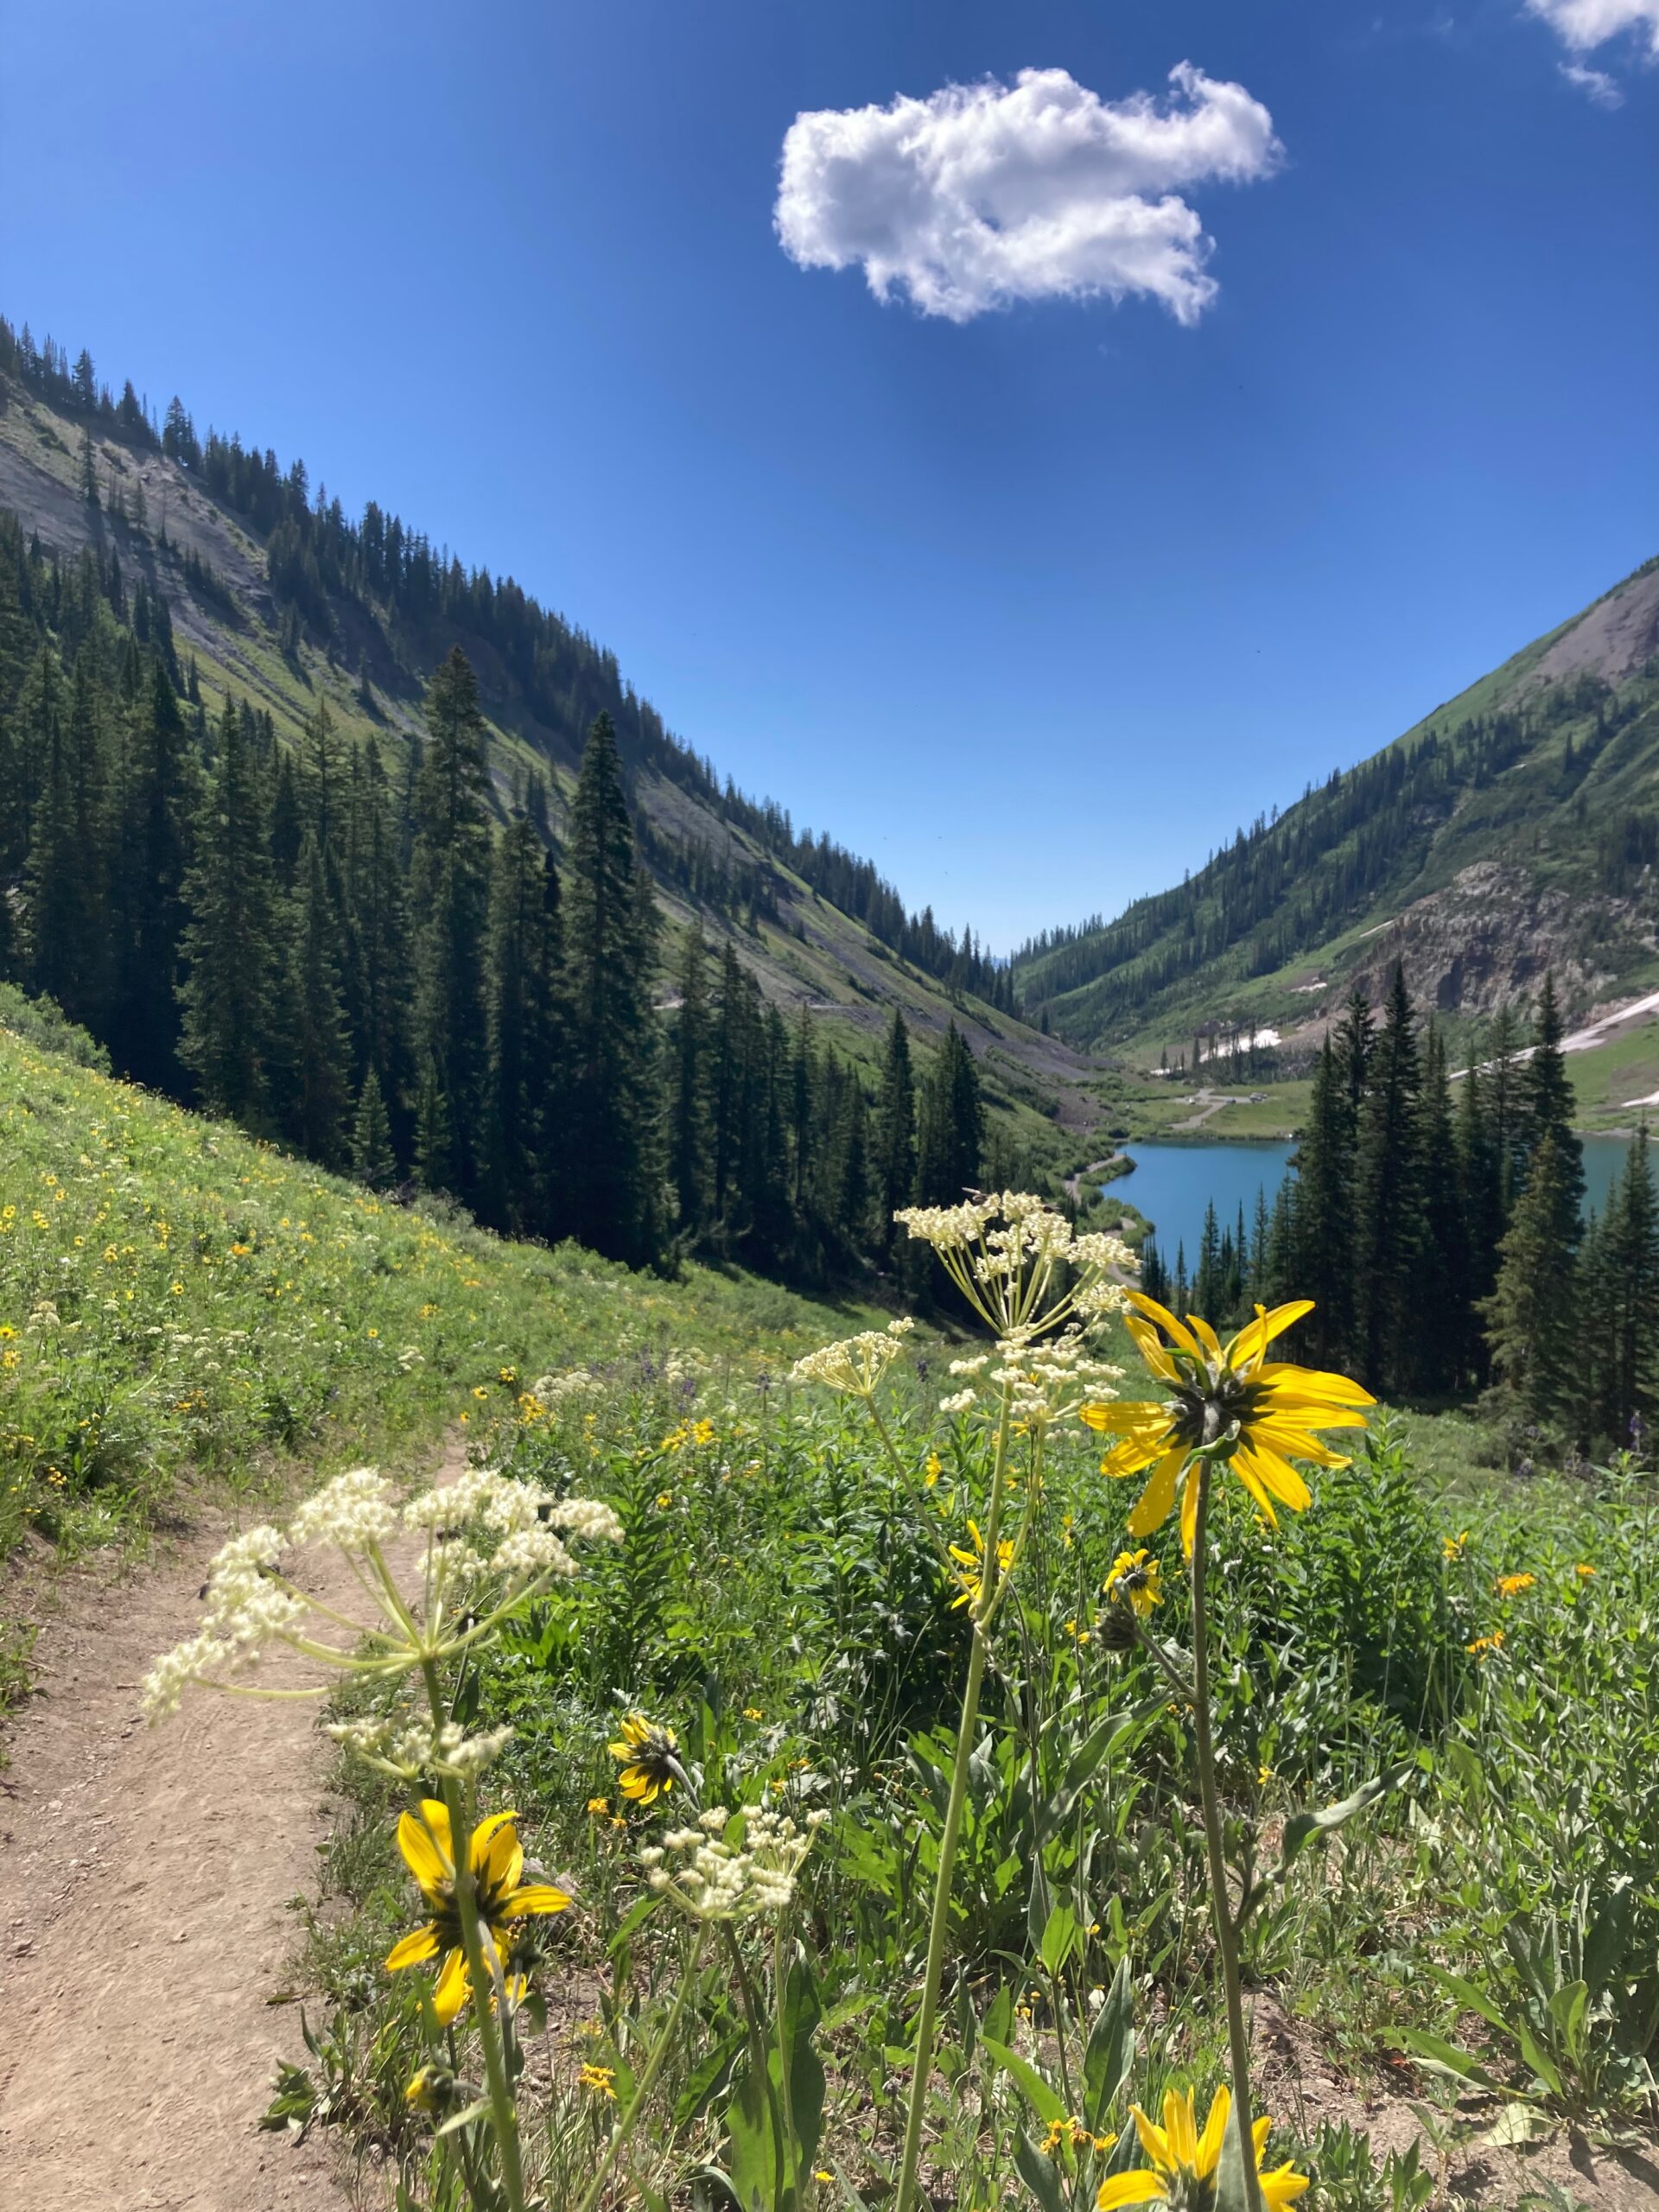
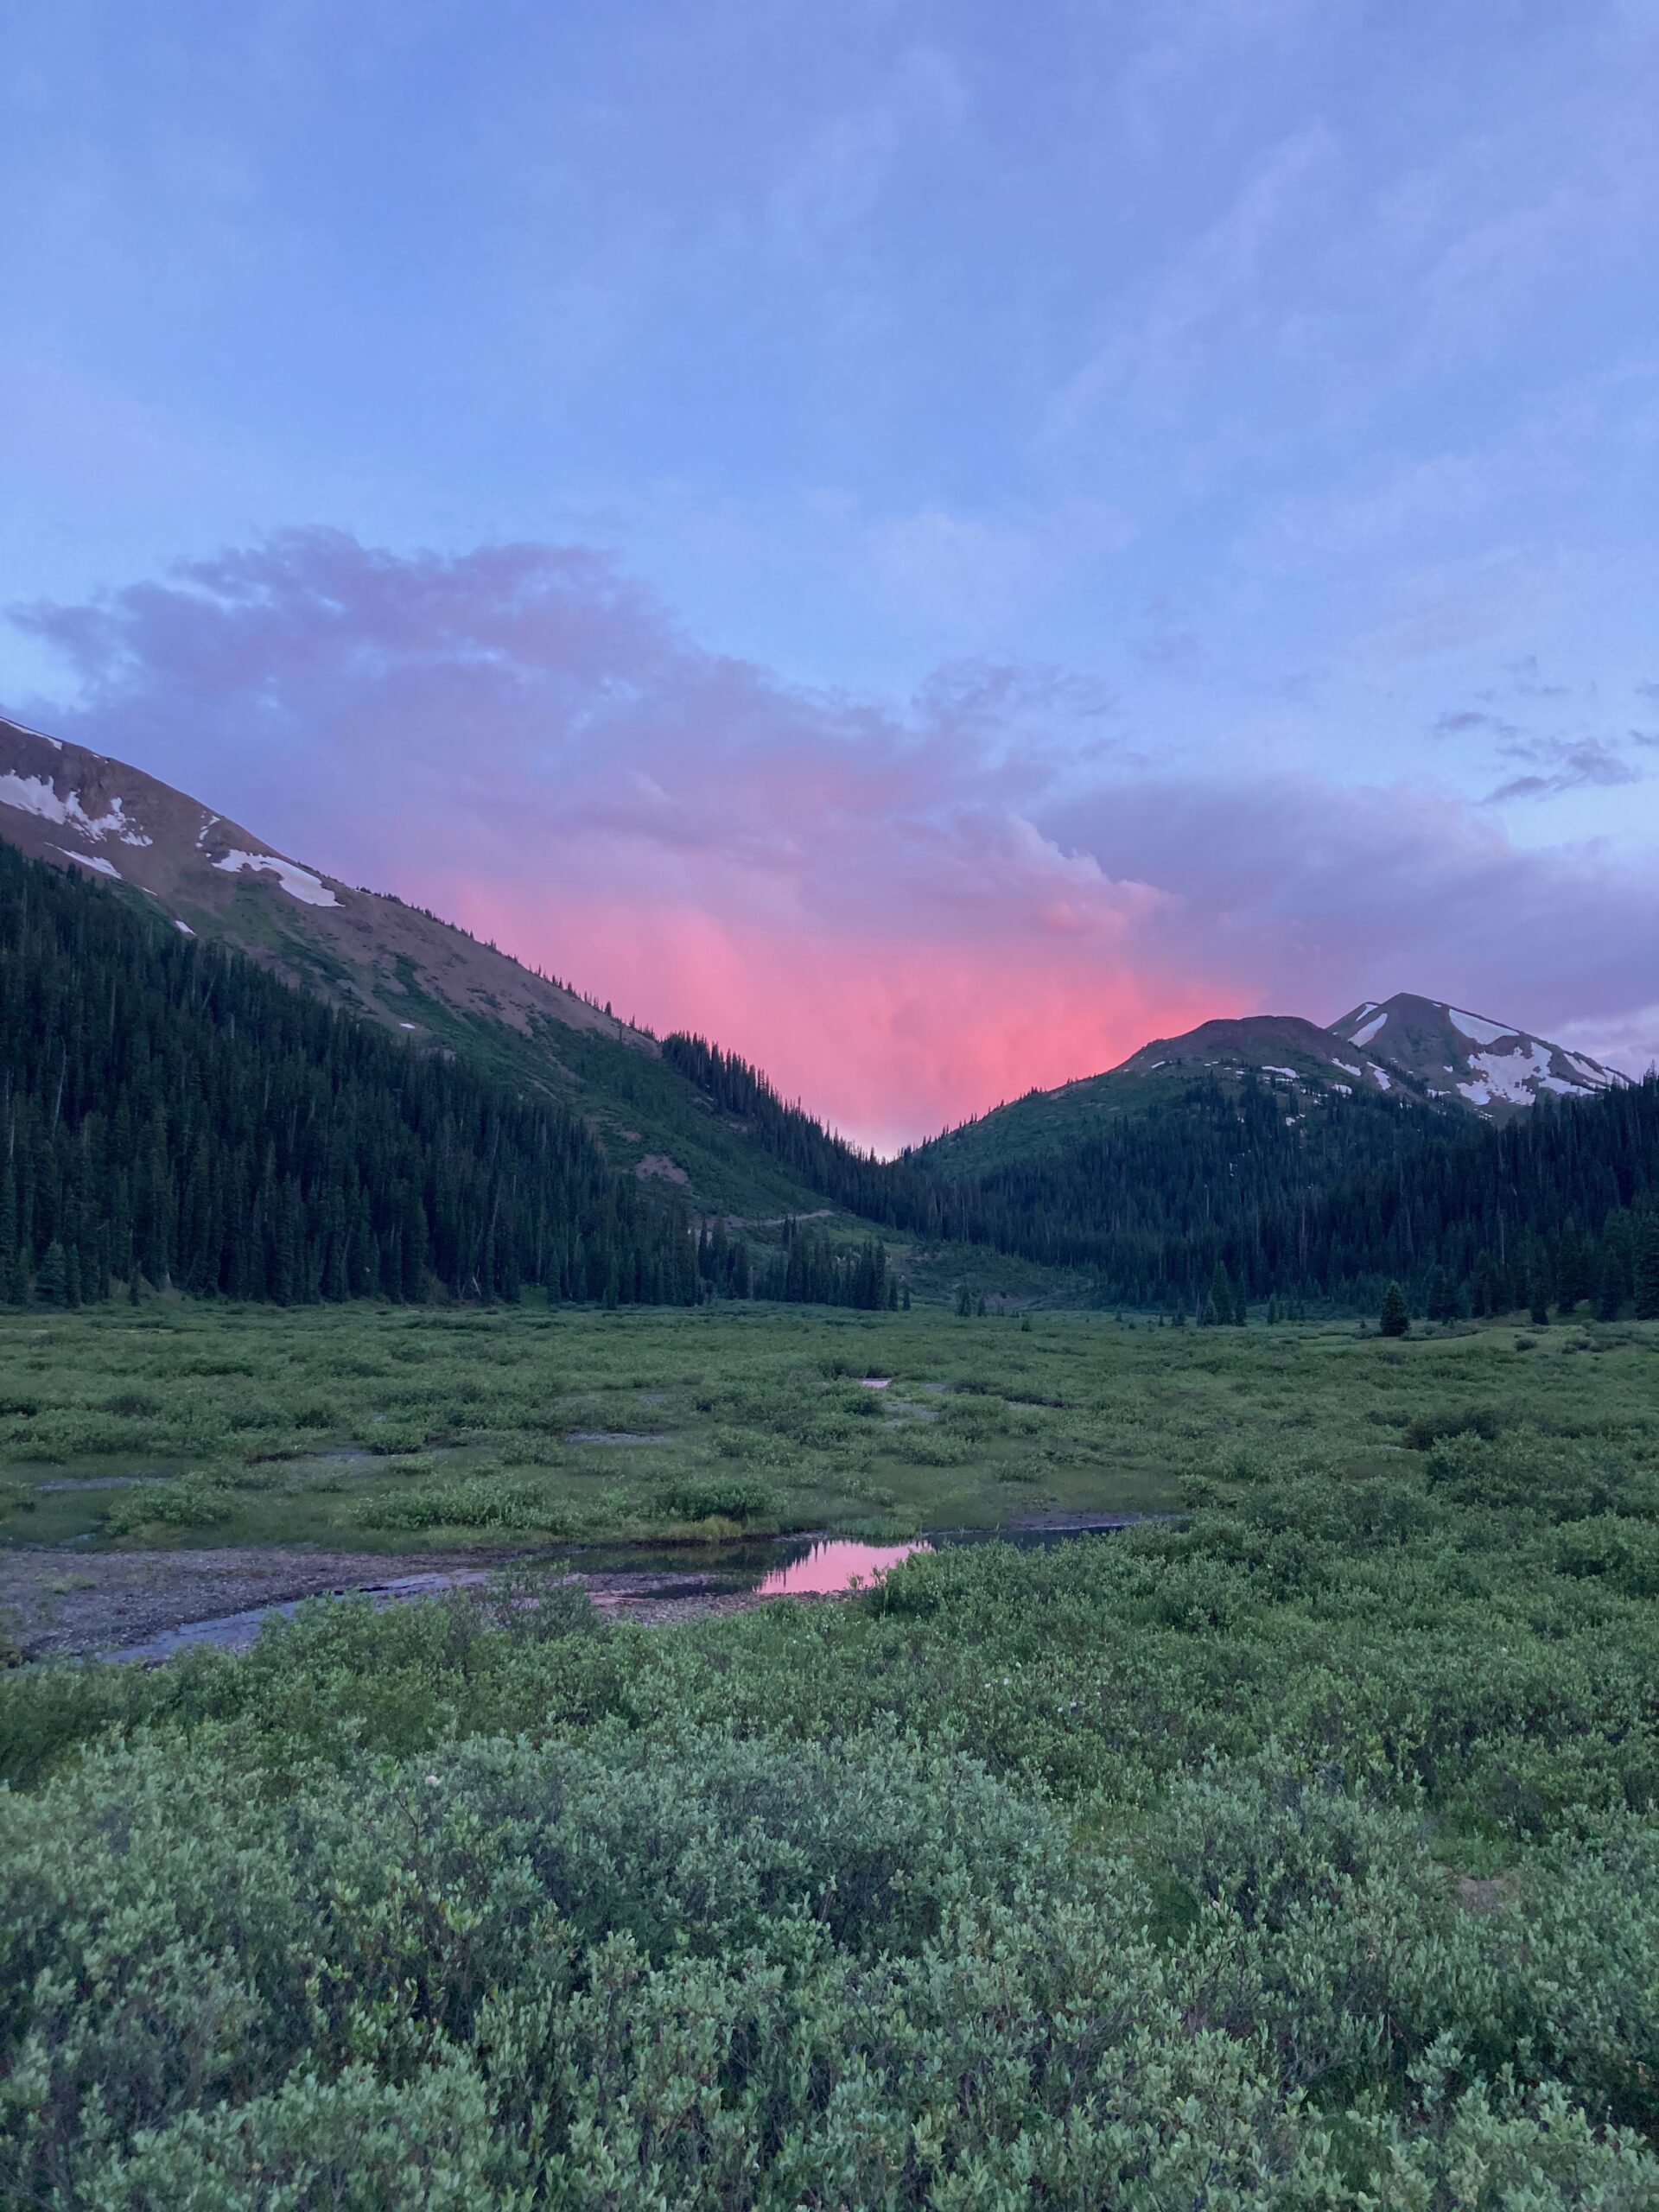
    Left: View of Emerald Lake from trail above. Right: Sunset over the valley after the river crossing.

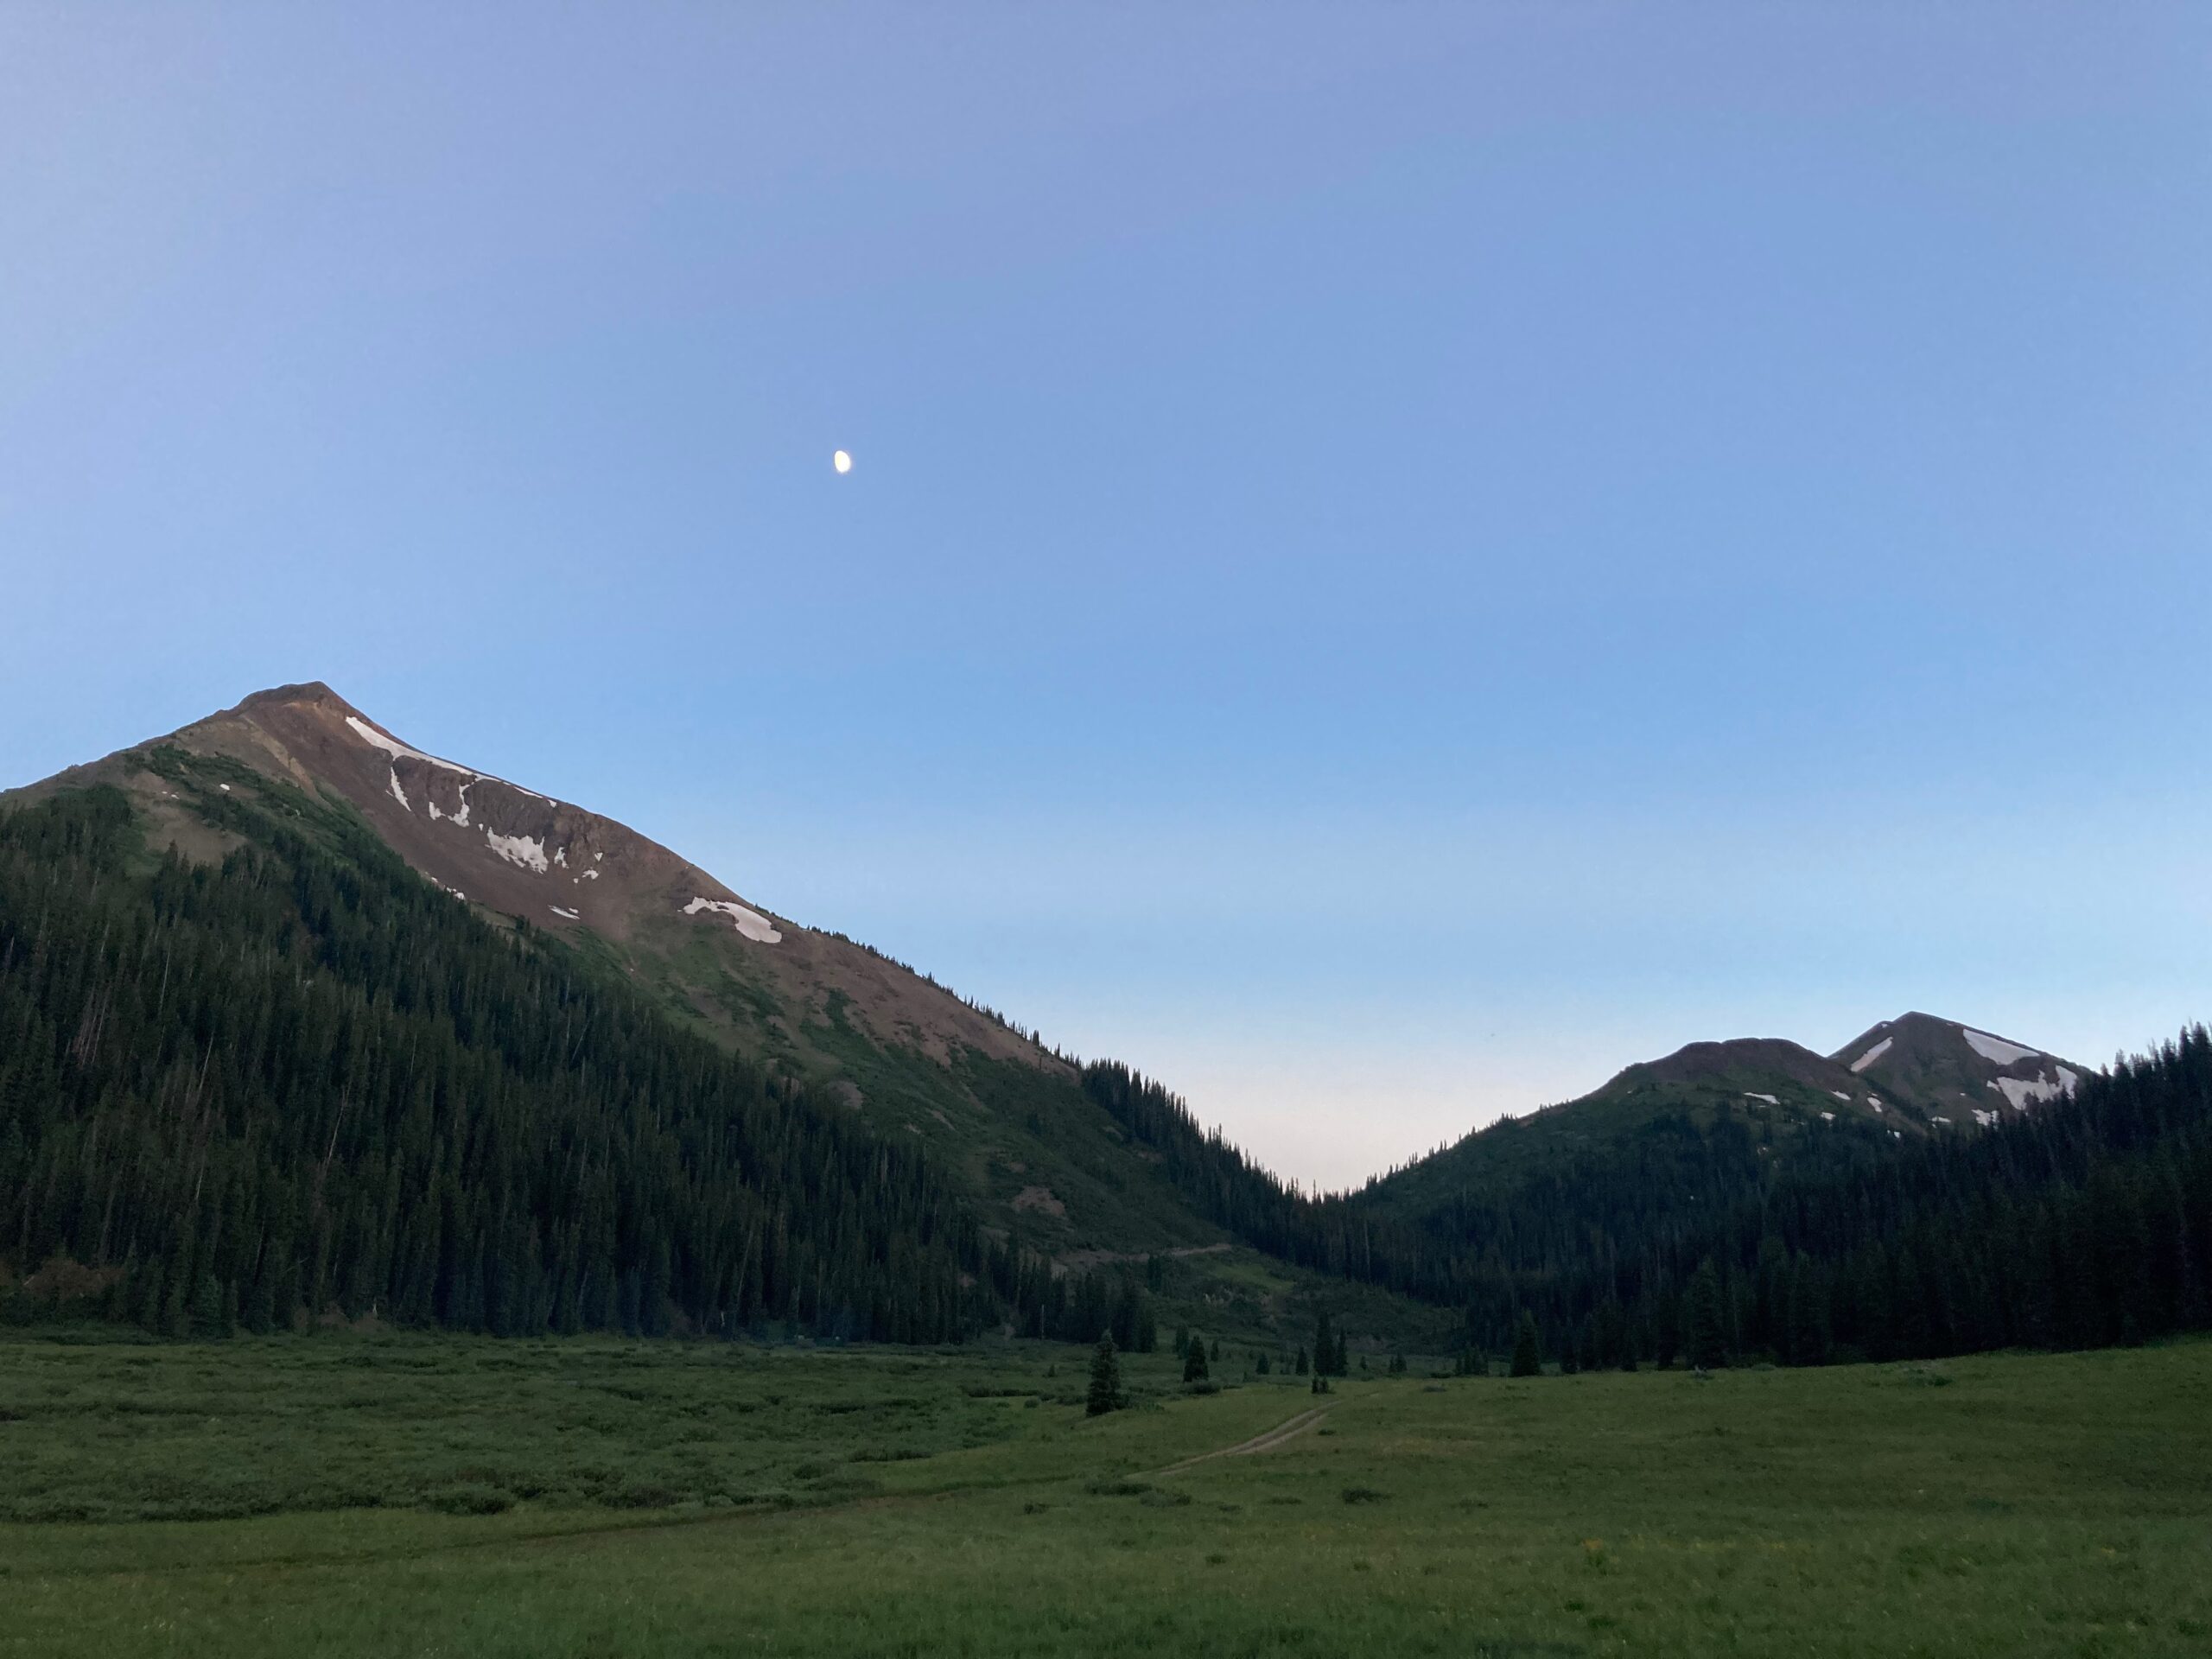
    Photo caption: View down into the river valley at twilight.

    9:30PM: Time for bed! After the sun sets, it gets very cold at this high elevation, and the most comfortable place to be is inside my warm sleeping bag. I set my alarm for 5:30AM and make sure all of my survey equipment is ready for the morning.

    This summer I learned a lot about how to effectively design and conduct a field ecology research study—especially how to be flexible and creative when problems arise. Field research is challenging but it is so refreshing to work outside in such beautiful places, and it’s especially rewarding to explore the trends in one’s data after a season of hard work. That’s how I’ll be spending the winter months, as do many field ecologists outside of field season—crunching the numbers in order to reveal the mechanisms of change in the ecosystems around us.