Category: Articles

  • Diary of an Undergraduate Thesis: The Finale

    Diary of an Undergraduate Thesis: The Finale

    This is a continuation of my first article from last semester where I started my undergraduate thesis writing process. You can find that here.

    ———————————

    January 24nd, 2024

    Just submitted my methods and materials section. Honestly, at this point I’m a bit more stressed about actually finishing data collection than the actual writing. I’ve kind of reached a “well it’s just an undergraduate thesis and not the end of the world” mentality, which is helping a little. To be honest, I did have a couple stress dreams last week (one was where I was scrolling through an endless Excel sheet of data that I had to analyze), so just accepting that it’s not that deep is good to me. But we keep working. 

    I also had to peer review one of my classmates’ methods section. We had this set up last semester too, where we had to peer review other people’s proposals. This semester, I’m paired with a group of other neuro students, so I feel like there’s a lot more back and forth I can actually have with them and their research. For this student, since we had similar experimental setups, I was able to see what she did well, and it also reminded me of things that I need to add to my section.

    One thing I’m trying to do this semester is to work on my thesis stuff more consistently, rather than pushing it all to the few days before the deadline. For that reason, I’ve blocked off an hour every workday on my calendar as a reminder to work on my thesis, even if it’s just for 15-30 minutes. I’ll let you all know whether this is helpful or if it stresses me out more to have my thesis on my mind all the time.

    ———————————

    February 27, 2024

    As always, problems come up right when you don’t want them to. The stereotaxic frame got broken, so we had to send it in for servicing. This means no surgery practice this month, which sets me back on my deadlines. Luckily, I’ve figured things out with my PI and my thesis class professor, but it’s still disappointing.

    Still, the time will pass anyway, and I did practice with perfusions and drop fixing in the meantime. It turns out that I had gotten rusty with these basic skills, so the time spent on that still felt worthwhile.

    While I’ve been waiting on unforeseen circumstances to clear up, I’ve continued working on my thesis results and discussion section. You might ask how I could write those parts without having data, but I did a method my professor calls “Mad Libs” writing, where you leave blanks where you don’t have the information yet. This has been helpful, since I have been able to get an outline of what my results and discussion sections will look like.

    So, I’ll see you in a month, when I hopefully have some data I can cut my teeth on.

    ———————————

    March 30, 2024

    Well, I’ve gotten pretty comfortable with surgeries, and next week I’m planning on doing my first optical implant. If all goes well, I can hopefully collect some data in two weeks. I’ve definitely been stressed about completing this thesis, and part of the process for me this semester is learning to deal with/live with the stress. This isn’t something I can finish in a weekend, after all, so I need to learn to work with this “unfinished task” bell dinging in my head until I turn this thing in. I really really want to have data collection done by the second week of April so we can do data analysis and I can submit the drafts to my readers. It feels like this semester has flown by faster than I thought, and I am worried about the deadline.

    In terms of what else I can do on the writing side, I am working on the schematics that will take up part of my figures in my results section. This is something you never really think about when you think of writing a thesis, but working on making good figures is difficult and time intensive. However, it feels good to be able to make those to have in my paper for now.

    There’s a lot going on outside of this thesis too–I’m getting ready for graduation, writing term papers, studying for tests, and looking at housing after graduation. It’s a lot to juggle, and I hope I’m doing okay. I’ve been reminding myself that I’m basically in the final lap of this process, and that I can do it.

    ———————————

    April 23, 2024

    Finally got some data this month, and I was able to write it all up and make a complete thesis of it all. It was stressful surrounding the data collection, but actually doing it went pretty smoothly. I typed everything up today and sent it off to my first and second readers.

    Really, I don’t know what to say here. After actually sending it off, I felt a little relief, but it wasn’t a super big change. That being said, I think I’m still focused on my work because I plan to continue it after graduation, and so my work doesn’t really feel finished. Still, I’m really happy that I was able to turn everything in with time to spare. By having it done about two weeks before I have to submit, this gives my readers enough time to give me feedback and turn in everything to UROP (undergraduate research office that approves undergrad theses).

    Now, it’s time to focus on everything else I need to complete before the end of the semester: term papers, exams, and graduation. But tonight, instead of working on it all, I gave myself the evening off. It’s something I deserve after all this, I think.

    Am I happy I did all this? Was it all worth it? I think it might be too early to tell, but I think it was well worth my time. I learned so much about research, working on a long term project, and scientific writing. But if I could go back in time and do one thing better, I would try not to stress as much about it. I think during this past year I’ve given myself so much unneeded pressure that never helped make my thesis better in the end. But I doubt that August 2023 me would have taken that advice to heart anyway. In any case, this is my last entry, because I consider this chapter of my life complete. I hope you enjoyed this mad little journal. I’m out.
  • Penitentes

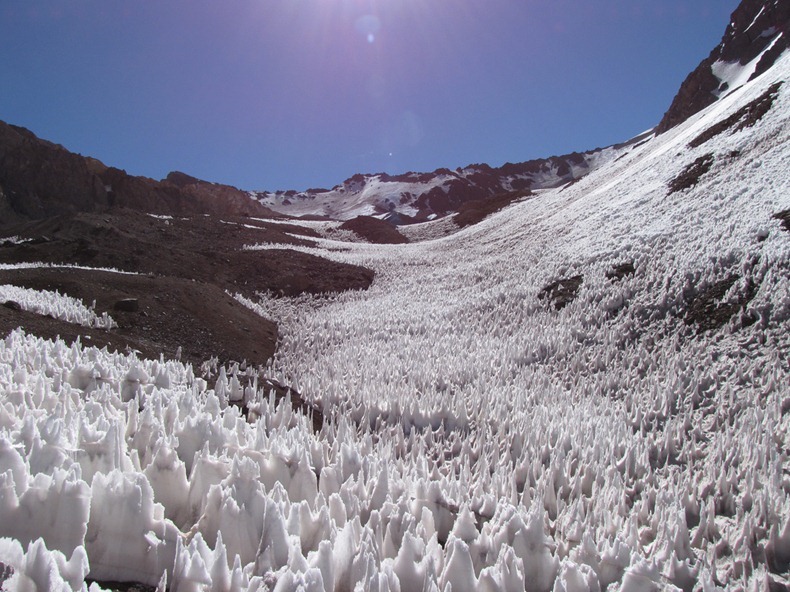
    If you wander over to the high-altitude regions of the Andes, you might spot fields of white figures, kneeling as if in prayer. Known as penitentes (based on the Spanish for penitent, one in penance), these are snow formations in the form of tall spikes.

    penitentes-13

    First described in literature by Charles Darwin in his book *The Voyage of the Beagle*, penitentes are structures that form at altitudes higher than 4,000 meters in snow-covered regions of the Dry Andes. He encountered them on his way from Santiago to Mendoza, and reported the local belief that these eerie formations were caused by the winds.

    This belief persisted while scientists came up with many alternative explanations such as electromagnetic orientation of snow, thermal eddies, and the descent of snow from landslides, none of which had proper backing until Lliboutry published his seminal “The Origina of Penitents” in the Journal of Glaciology. Lliboutry studied a region of penitentes and hypothesized that differential ablation was the cause of the structures.

    Ablation refers to the combined processes removing ice from a glacier surface. The main loss of ice is a result of sunlight hitting it. Although it feels like a fair assumption that sunlight hits the ground evenly, because of the way light reflects, certain regions of the snow cover receive more light and conversely energy than others.

    The crests remain cool enough to maintain their structure, but the valleys and spaces between individual penitentes have concentrated sunlight, causing them to wear down and melt over time. What starts off as random differences in the speed of melting snow cover accelerates into a spiky formation as more and more concentrated regions begin to melt over time.

    Penitentes are an eerie sight to look at, and could potentially impact our travels in space too!

    A 2018 paper by Hobley et al. theorized the presence on penitente-like structures on the surface of Europa, one of Jupiter’s moons. Europa is a promising target for astrobiology research due to its presence of a subglacial ocean, and the news of penitentes on its surface creates challenges for aerospace engineers designing landing gear. While the penitentes on Earth reach a meter or so tops, the modeled structures on Europa would be 15 meters tall!

    Discussion and design of Europa landers has now shifted to consider penitentes, but their presence on Europa is still hotly contested. In a 2023 study, Warren goes in depth why the Hobley study might be incorrect. He contests that Hobley misrepresents Lliboutry’s statements, and that the evidence Hobley sites can be reattributed to subsurface irregularities.

    The court is still out on whether or not penitentes are a hazard for flying to Europa, but they could still pose benefit to astrobiology research. A study in 2017 identified communities of microbes living at the tips of penitentes, sometimes giving them a reddish tint. This visual feature is something prominent in painted depictions of the structures. Studying the distribution of microbes here can be a valuable source of data for understanding the presence of bacteria in extreme environments.


    Works Cited

    Hobley, Daniel E. J., et al. “Formation of Metre-Scale Bladed Roughness on Europa’s Surface by Ablation of Ice.” Nature Geoscience, vol. 11, no. 12, 8 Oct. 2018, pp. 901–904, https://doi.org/10.1038/s41561-018-0235-0. Accessed 20 Apr. 2024.

    Kaushik Patowary. “Penitentes: Peculiar Spikey Snow Formation in the Andes.” Amusing Planet, 25 May 2012, www.amusingplanet.com/2012/05/penitentes-peculiar-spikey-snow.html.

    Kristine De Abreu. “Natural Wonders: Penitentes» Explorersweb.” Explorersweb, 11 Dec. 2022, explorersweb.com/natural-wonders-penitentes/.

    Lliboitry, Louis. “The Origin of Penitents.” Journal of Glaciology, vol. 2, no. 15, 1954, pp. 331–338, www.cambridge.org/core/journals/journal-of-glaciology/article/origin-of-penitents/FACAAF8EF9A38B0F14AE85DC6805B8C7/core-reader, https://doi.org/10.3189/s0022143000025181. Accessed 20 Apr. 2024.

    Solon, Adam J., et al. “Microbial Communities of High-Elevation Fumaroles, Penitentes, and Dry Tephra “Soils” of the Puna de Atacama Volcanic Zone.” Microbial Ecology, vol. 76, no. 2, 5 Jan. 2018, pp. 340–351, https://doi.org/10.1007/s00248-017-1129-1. Accessed 20 Apr. 2024.

    Warren, Stephen G. “Snow Spikes (Penitentes) in the Dry Andes, but Not on Europa: A Defense of Lliboutry’s Classic Paper.” Annals of Glaciology, 23 Mar. 2023, pp. 1–5, https://doi.org/10.1017/aog.2023.12. Accessed 20 Apr. 2024.

  • The Magic of Shrinky Dinks and My ASF After Dark Experience

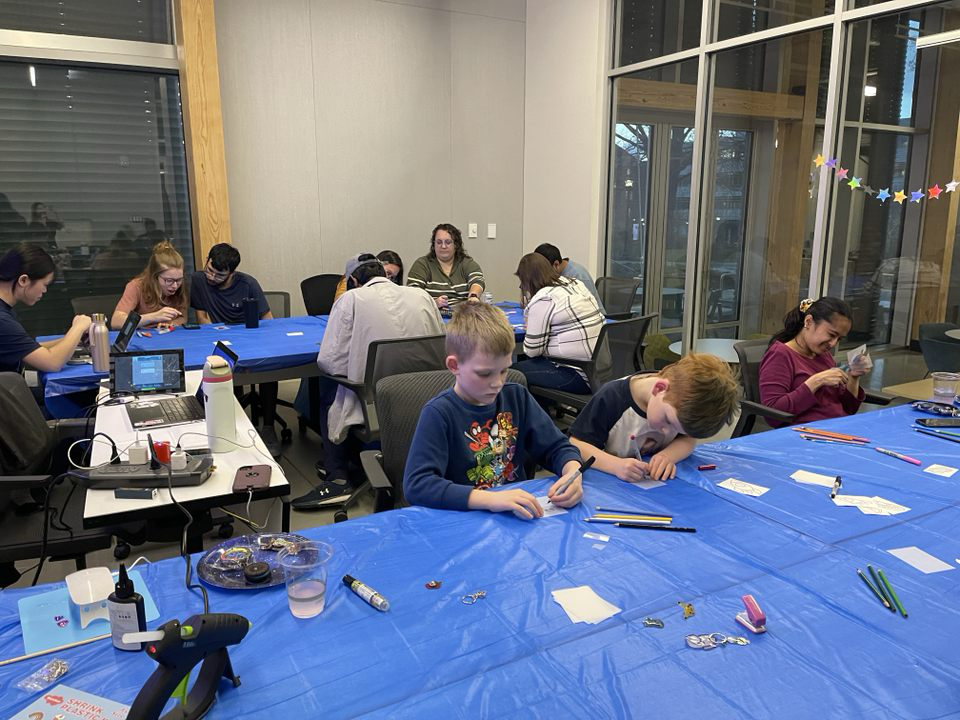
    My first semester at StemCOMM VIP offered both excitement and trepidation when I learned about the ASF After Dark event. Since high school, I hadn’t been involved in planning science-related activities, and I worried my knowledge in science related topics might be limited. However, through working with my sub-team during the planning phase, I discovered that science is everywhere around us, not something you have to constantly seek out.

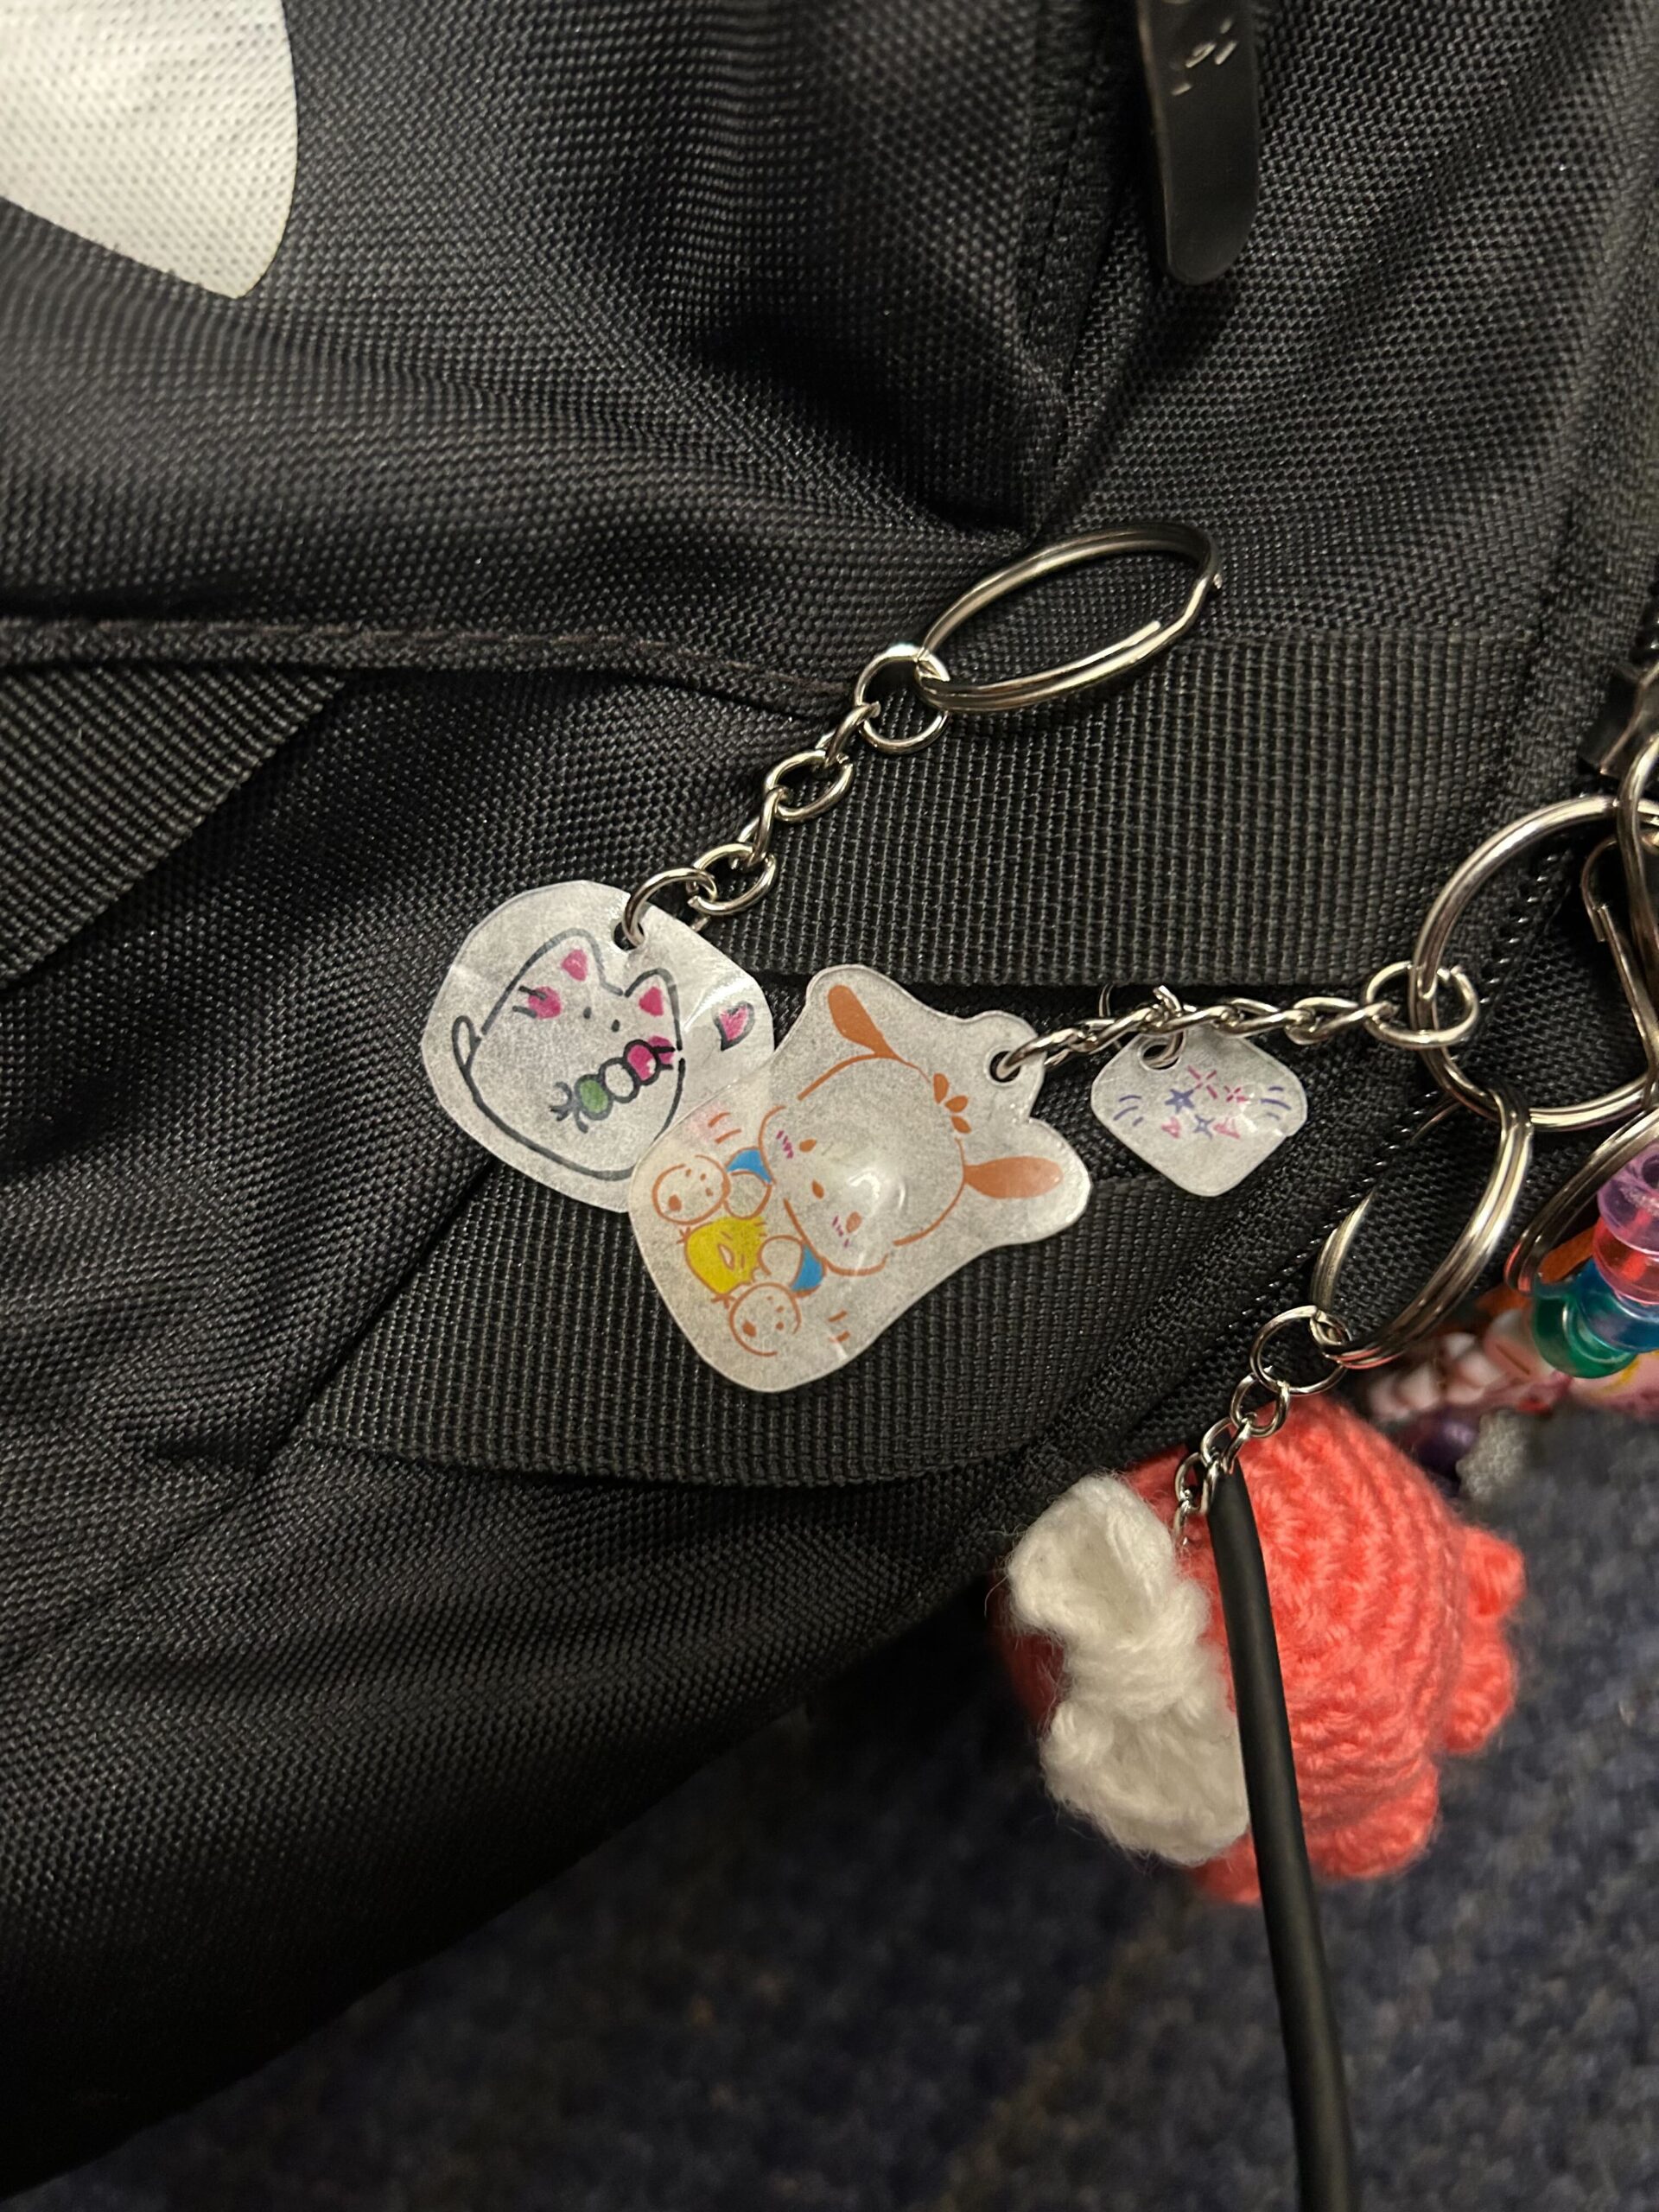
    Initially, my sub-team and I envisioned a “create your own planet” activity using Styrofoam spheres and planetary trivia. But we were worried that adults might not find this as engaging, so we pivoted to shrinky dinks. These are incredibly simple: secure a shrinky dink kit, draw on the flexible plastic sheets from the kit, shrink them with heat, and transform them into keychains, magnets, or pins!

    The reason we choose to do shrinky drinks was because of the unique process of how shrink dinks formed—almost like magic. This magic of shrinky dinks lie in the scientific process triggered by heat. These plastic sheets contain polystyrene, a material made of long, chain-like molecules called polymers. When heated, these polymers straighten out, allowing them to pack together more efficiently, shrinking the material to roughly one-third of its original size.

    At the event, I helped with guest reception, brief explanation of the science behind shrinky dinks, and distributing supplies. We provided stencils for tracing and a variety of charm options. The event itself was filled with excitement as guests delighted in the activities and the new experiences our shrinky dink provided. Witnessing countless faces light up as their shrinky dinks transform into their personalized charm was truly magical. Guests would kept going back and create new designs, even our own sub-team! The magic of shrinky dinks, it seems, never gets old!

    The turnout for the ASF event went so much better than I had expected. I had concerns about low attendance, but it was fantastic to see guests genuinely enjoying the experience and immersing themselves with all the science activities for the night. The guests that were in attendance were eager to learn what shrinky dinks were and I loved seeing their designs form into charms. My experience with ASF after dark was a truly a heartwarming reminder of how science brings the world around us to life.

    Sources:

    University, Carnegie Mellon. “Shrinky Dinks – Gelfand Center – Carnegie Mellon University.” Shrinky Dinks – Gelfand Center – Carnegie Mellon University, www.cmu.edu/gelfand/lgc-educational-media/polymers/molecular-rearrangement/shrinky-dinks.html#:~:text=When%20the%20film%20is%20heated,by%20rapid%20cooling%20during%20manufacture. Accessed 20 Apr. 2024.

    (View the source above to learn more about shrinky dinks!)

  • Is Love Truly Blind? An Analysis of the Popular Dating Show

    \

    From its initial debut on Netflix in 2020, Love is Blind has captured audiences and secured itself as one of the most popular dating reality shows of the 21st century. What makes Love Is Blind different from other popular dating shows is that the contestants date and propose to their prospective partner from behind a wall, without every seeing each other. It isn’t until they solidify their engagement that the contestants are able to see what their partners look like. Another difference between Love Is Blind other reality shows? Love Is Blind takes itself extremely seriously. The hosts, Nick and Vanessa Lachey, are notorious for referring to their show as “an experiment”. Instead of a hypothesis for this “experiment” the hosts simply repeat the leading question: “Is love truly blind?”.

    In this article, I attempt to analyze Love Is Blind as an experiment from a scientific perspective, in an effort to answer the question, “does the inability to see your partner during a dating stage increase the viability of a long term relationship compared to a typical dating scene where both parties can see one another?”. To do this, I will compare Love Is Blind another popular reality dating show, Love Island. In Love Island, contestants are not only able to see each other, but they are encouraged to judge their fellow contestants by their physical appearances. We can compare the outcomes of each of these shows to conclude which dating strategy is more effective in forming successful, lasting relationships.

    Because this is an experiment, we will need to analyze our variables. It is imperative to account for the major differences between these shows, and note that our comparison will be far from perfect. For one, Love Is Blind is a marriage-focused show. Contestants (allegedly) sign up for the show in hopes of finding a husband or wife. Most of the contestants on Love Is Blind are in positions in their life where they are ready to commit to long-term relationships. This is much different than Love Island, which engages in a culture of flirtatiousness, changing partners, and employs a cast of younger contestants, who are less likely to want to pursue a long-term relationship. Love Is Blind is unique in that it involves such a large cast of singles from both sexes, and follows multiple couples’ pursuit of marriage. There are no shows quite like Love Is Blind, which makes it difficult to assess it as a true experiment. An ideal scenario would involve recreating the show perfectly, but with face-to-face dating instead of blind dating. Of course this is impossible, so our comparison to Love Island, is the next best option. To eliminate cross-cultural variables, we will be analyzing the slightly less popular US version of Love Island.

    I will now present the data that I collected from each reality show. To start, Love Is Blind has been running for 6 seasons, each with 30 contestants. Out of these 180 contestants, 61 contestants have become engaged on

    the show, or 31 couples (One contestant was engaged twice to two different partners). Out of these 31 couples, 20 couples broke up on the show, 9 couples are still together, and 2 couples married each other on the show, but eventually broke up. This adds up to a 29% long-term success rate out of all the couples engaged on the show, and an overall 10% success rate out of all the contestants over all 6 seasons.

    In comparison, Love Island, US has taken place over 5 seasons, each with 25 contestants, for a total of 125 contestants over the whole show. Out of these contestants, 15 couples have continued to date after the show. Out of these 15 couples, only three are currently together. This adds up to 20% chance that a couple formed on the show will stay together, and an overall success rate of 4.8%. This number is also likely generous, as Love Island typically introduces new contestants in the middle of seasons, some seasons almost doubling in cast size before the end.

    Based on these numbers, it is clear that Love Is Blind is more successful than Love Island at forming lasting relationships. In fact, Love Is Blind’s statistics of forming 9 married couples after only a 6 season runtime is unprecedented in dating shows. No other show comes close to Love is Blind in the sheer number of successful relationships formed. Even marriage-focused shows like The Bachelor pale in comparison to the success rate of Love is Blind. After 28 seasons of the Bachelor, and 20 seasons of The Bachelorette, only 9 couples from the shows are still together to this day. This means that if you are the “Bachelor” or the “Bachelorette” you have an approximate 18.75% chance of forming a lasting relationship during your time on the show. While this is better than the 10% success rate of Love Is Blind, it isn’t much better. Considering the fact that the bachelors and bachelorettes are dating 25-30 potential partners, and have no competition, it makes sense that there would be a decently high success rate. Additionally, most seasons of The Bachelor and The Bachelorette end in an engagement, so it would be reasonable to expect more than 9 lasting couples after 48 seasons.

    Given the data and considering the variables, it seems evident that Love Is Blind has an impressively high success rate compared to similar reality dating shows. Love is Blind has an overall success rate of more than 2x that of Love Island, US. While it does have an 8.75% lower success rate than The Bachelor/Bachelorette franchise, the average contestant on Love Is Blind has an unprecedentedly high chance of finding love than the average contestant on these shows. It seems very probable that the factor contributing to this high likelihood of success is the blind-dating style. There is evidence in support of blind dating that suggests that deeper, and more lasting bonds are formed when physical appearance is taken out of the equation. It is also possible that age, sociodemographic factors, time frame, and casting decisions could also be contributing to the show’s success. Whatever the reason, there is absolutely evidence that blind dating can lead to a comparatively high relationship success rate in a reality TV format. In other words, there is evidence that love is, (or certainly can be) blind.


    Sources


    Delbyck, Cole. “Which Couples Are Still Together from Every Season of Love Is Blind?” Netflix Tudum, Netflix Tudum, 28 Mar. 2024, www.netflix.com/tudum/articles/love-is-blind-who-is-still-together-every-season.

    “Love Is Blind (TV Series).” Wikipedia, Wikimedia Foundation, 2 Apr. 2024, en.wikipedia.org/wiki/Love_Is_Blind_(TV_series).

    “Love Island (American TV Series).” Wikipedia, Wikimedia Foundation, 7 Apr. 2024, en.wikipedia.org/wiki/Love_Island_(American_TV_series).

    Siwak, Miranda. “Love Island USA Couples: Who Are Still Together and Who Broke Up?” Us Weekly, 29 Mar. 2024, www.usmagazine.com/entertainment/pictures/love-island-usa-couples-who-are-still-together-and-who-broke-up/.

    “Stop Swiping, Start Talking: The Rise and Rise of the Blind Dating App.” The Guardian, Guardian News and Media, 8 Nov. 2022, www.theguardian.com/lifeandstyle/2022/nov/08/stop-swiping-start-talking-the-rise-and-rise-of-the-blind-dating-app.


  • The Joy of Humanity and Clothing: Growing Culture and Protecting Our Planet Earth

    The Joy of Humanity and Clothing: Growing Culture and Protecting Our Planet Earth

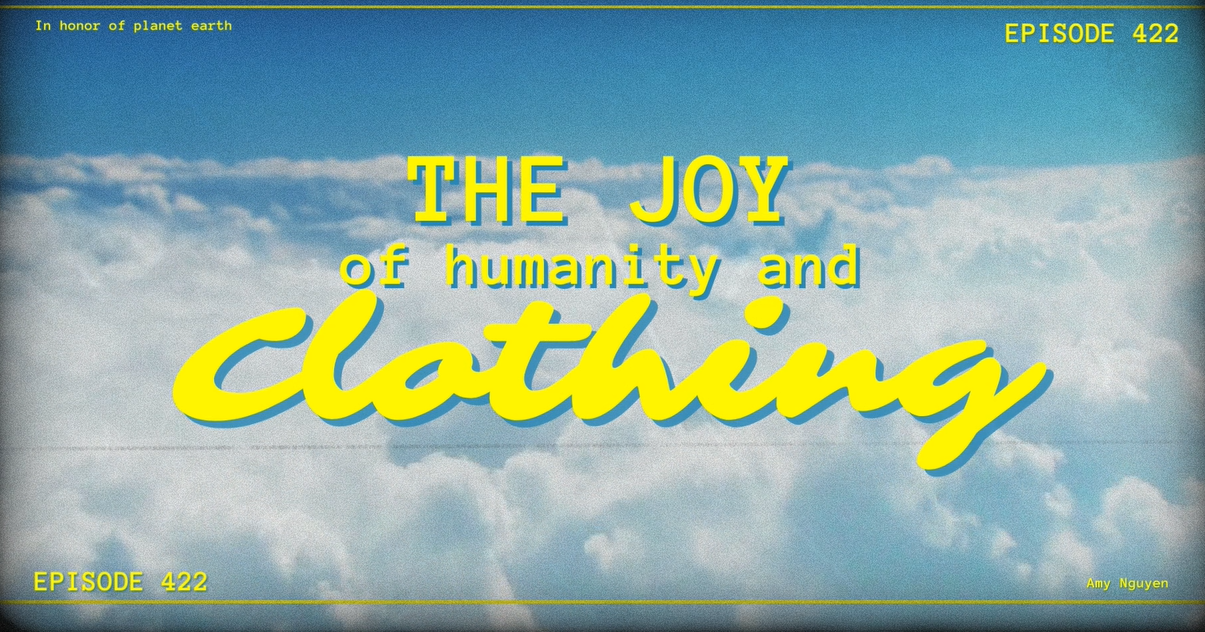
    While exploring the world of clothing and textiles, I created a collage of videos based off what I consider to be “The Joy of Humanity and Clothing”, culture. While culture is beautiful and a root joy for nearly all cultures, it is vital to remember that the unintended consequence of these rapidly evolving trends is over consumerism. Overconsumption is a constant issue in our time as the rise of fast fashion and the quicker and neverending cycle of trends.  

    There are three categories of textile wastes: pre-consumer (“clean” by-products from the manufacturing process), post-consumer (textiles that no longer have value after use such as towels, sheets, etc.), and industrial textile waste (“dirty” waste materials created from their manufacturing process) (Juanga-Labayen). Although textiles can nearly be 100% recyclable and it would be ideal to reuse all parts of textiles, in reality, much of it goes to waste (Juanga-Labayen). The EPA measures the creation, recycling, energy recovery, and landfilling of most textile materials. In 2018, the rate of recycling was estimated, by the Environmental Protection Agency (EPA), to be around 14.7% with the estimated rate of recycling clothing to be around 13%, as reported by the American Textile Recycling Service (EPA 2023). Out of all of the material-specific waste (MSW) combusted in order to recover energy, textiles make up nearly 10% of all recovered energy (EPA 2023). Textiles make up nearly 8% of all waste put into landfills (EPA 2023). Although the rate of recycling and energy recovered via combustion have remained relatively standard throughout the years, so has the rate of textile waste that goes to landfills. And while the rates are relatively stable, the amount of overall consumption has drastically skyrocketed due to overconsumption.  

    There are two major types of textile recycling: mechanical and chemical. Mechanical recycling is the physical recycling that we often think about when we think of recycling such as reusing and repurposing clothes and textiles through upcycling and downcycling. Chemical recycling is the process of depolymerizing the polymers in clothes or dissolving the fibers of cotton (Juanga-Labayen). Polymer or oligomer recycling entails the process of taking apart the fibers while leaving behind the polymers or oligomers intact (Juanga-Labayen). This then allows for the materials to be fully recycled into new textiles. For textiles that contain biodegradable materials such as cotton with over 50% cellulose, anaerobic digestion is used in order to create biogas that is rich in methane for energy use. Cotton garments can also be treated to break down and be used as compost for certain things although they have not been approved for use in farming. Another alternative is that textiles can also be treated with alkalis to be fermented and made into feeding for ethanol production. This process is ideal for clothing that may have some polyester blended into cotton such as jeans (Juanga-Labayen).  

    While there have been many innovative ways to reinvent and reuse textiles, the root cause of many of these issues is that there is a staggering increase in textile consumption along with unwanted textiles. Reusing is the best option but both reusing and recycling are much better than burning or landfilling textile materials. While I and many others have been able to find ourselves through our self-expression through clothing, we must also learn more about the “behind the scenes” of the production of our clothing. 

    Sources: 

    EPA, Environmental Protection Agency, www.epa.gov/facts-and-figures-about-materials-waste-and-recycling/textiles-material-specific-data. Accessed 19 Apr. 2024. 

    Juanga-Labayen, Jeanger P., et al. “A Review on Textile Recycling Practices and Challenges.” MDPI, Multidisciplinary Digital Publishing Institute, 16 Mar. 2022, www.mdpi.com/2673-7248/2/1/10. 

    “The Aftermath of Fast Fashion: How Discarded Clothes Impact Public Health and the Environment.” SPH The Aftermath of Fast Fashion How Discarded Clothes Impact Public Health and the Environment Comments, 22 Sept. 2022, www.bu.edu/sph/news/articles/2022/the-aftermath-of-fast-fashion-how-discarded-clothes-impact-public-health-and-the-environment/. 

  • The Omnivore’s Dilemma: What Will You Put on Your Plate?

    The Omnivore’s Dilemma: What Will You Put on Your Plate?

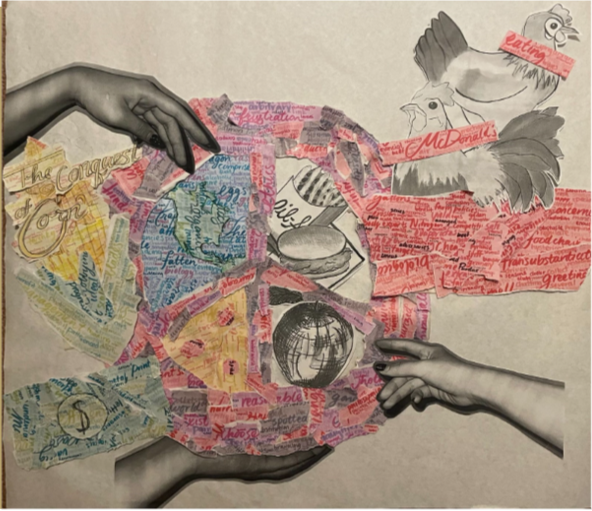
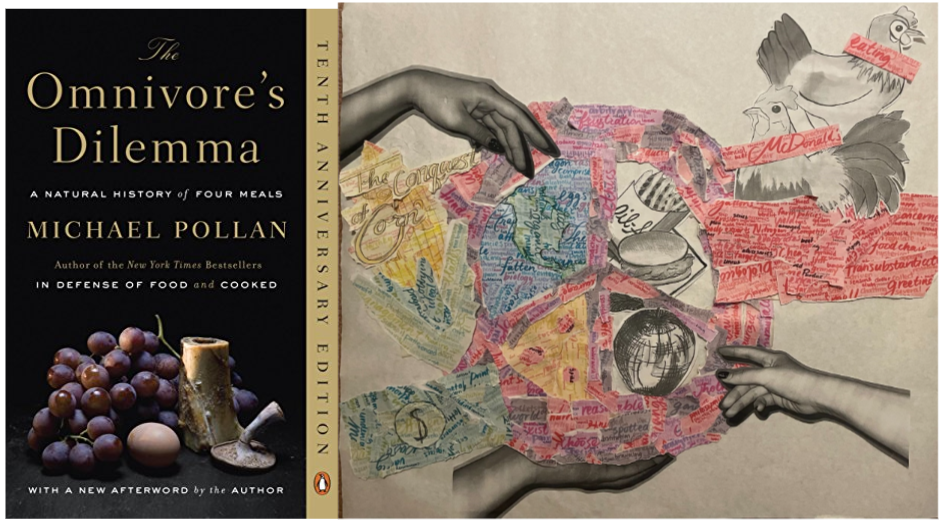
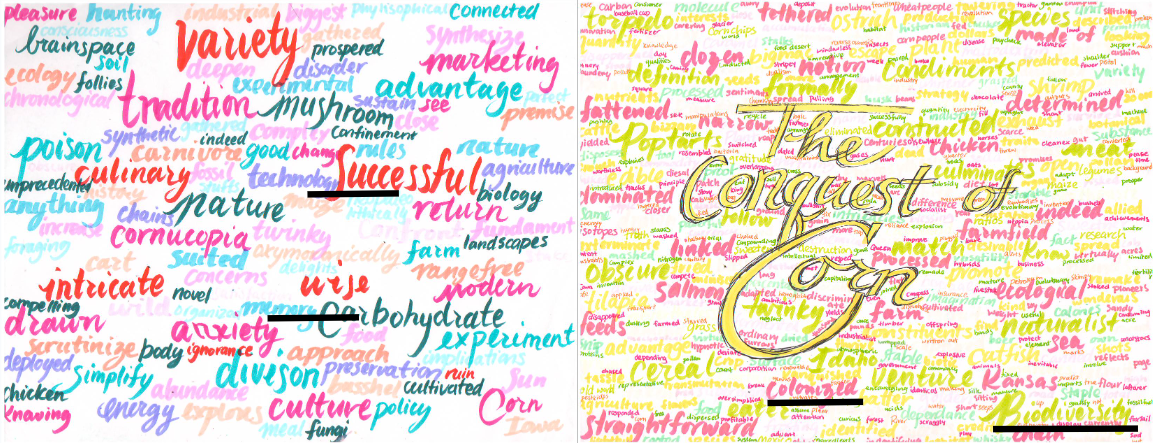
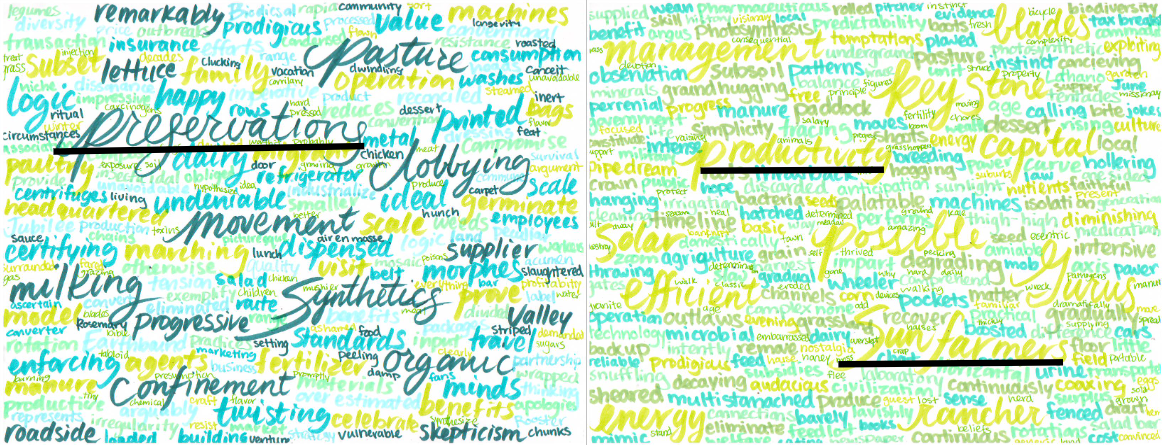
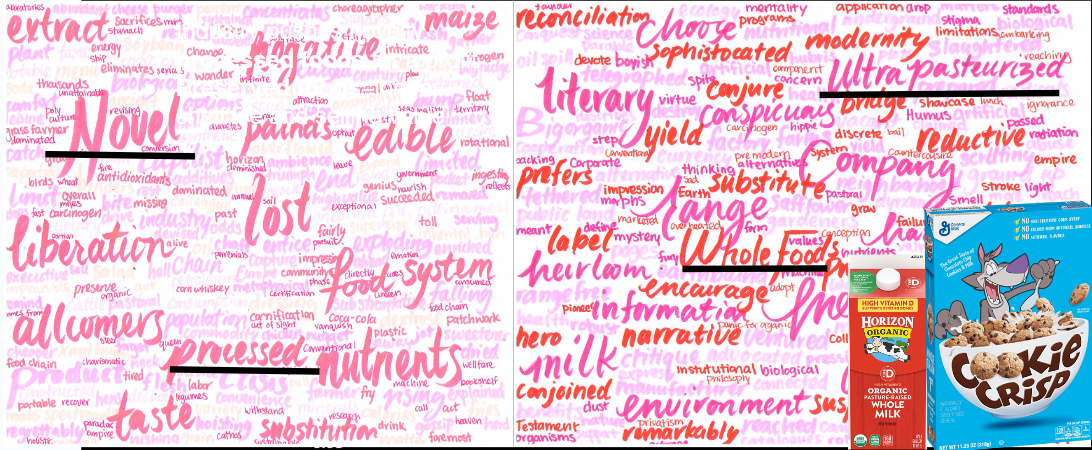
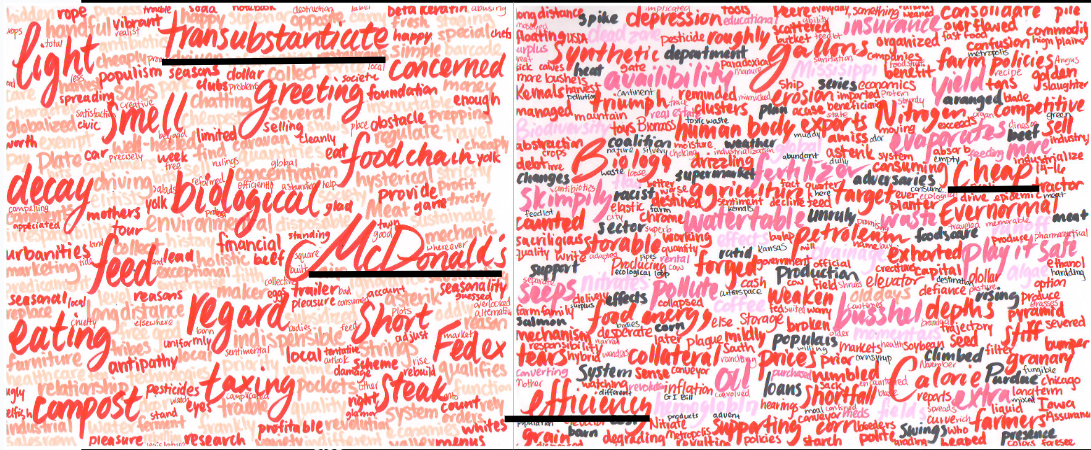
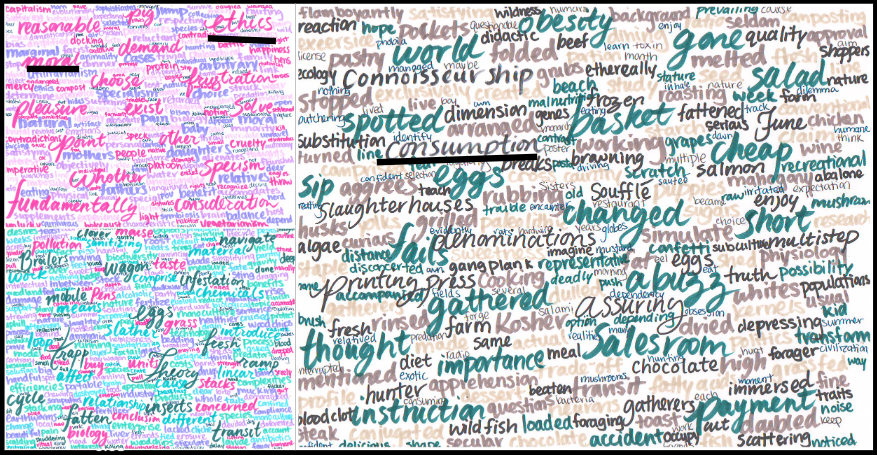
    The Omnivore’s Dilemma: A Natural History of Four Meals written by Michael Pollan is an intriguing book about the current food situation of America and by marking major developments in food and his journey to find “the best” way to eat. To choose to eat every day is to choose to survive but we rarely think about the science behind our choices or behind why those are the only seemingly available choices. While researching this topic and throughout reading this book, I made word clouds around central themes using words said throughout the book in order to point out things to consider while we make our food choices. Every time you look closer at any of the word collages, you notice something different to consider when thinking about food. I then made a collage incorporating these various topics because I believe that art would be the best way to communicate about food, another lesser thought about art form. Both food and art are forms of therapeutic activities that we oftentimes fall back on.  

    Michael Pollan coins an interesting term: the People of Corn which he uses to contrast the difference between the usage of corn by Americans and Native Americans (Pollan). America can very easily be considered a nation run on corn, on corn syrup, on corn-starch, and on corn-based fuel.  

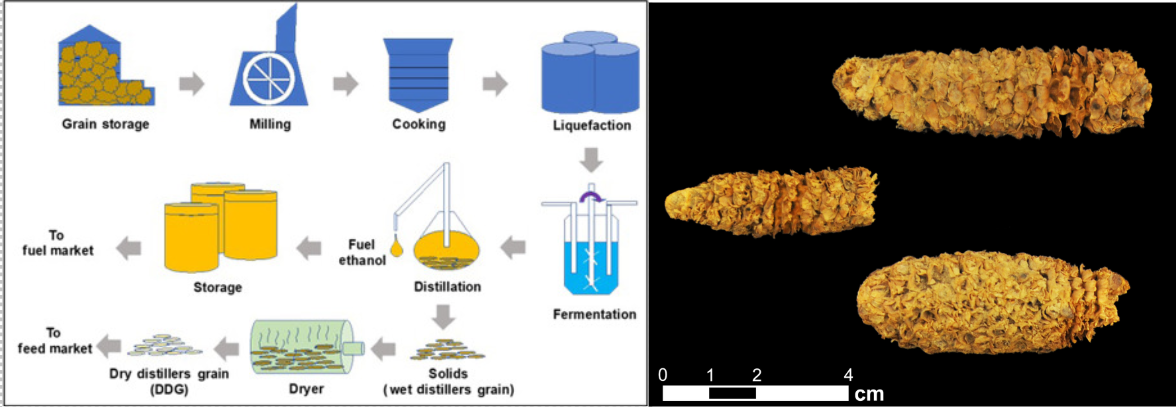
    Unlike the Native Americans, current Americans heavily process corn to the point that it is no longer recognizable. This is not only an amazing feat of innovation, but its impact is also astounding as well. Corn was originally an incredibly thin and weed-like grass with some seeds at the top, but its current form is the result of generations of domestication and modification (Smithsonian 2020). The modern corn is very large, sweet, and fleshy making it an ideal source of energy in both food, livestock feed, and fuel. America grows over a third of the entire world’s corn and dominates the industry in the use of corn-based products in food and in bioethanol (Swain 2019). Corn is an incredible fuel source with it being one of the biggest components in the bioethanol industry, but it has many drawbacks considering that producing more fuel will limit how much food can be produced (Swain 2019). There are also many more unintentional effects of the abundance, and many uses for corn. Corn is a large factor as to why so many processed foods exist today. 

    Credit Thomas Hopper. 

    Processed foods are by no means entirely terrible, but it is important to consider that many processed foods exist solely because they are profitable even though they are at the expense of many of us. But interestingly, there is a high correlation between the higher income countries having higher rates of processed foods and obesity while middle income countries are following suit (Monteiro 2013). A neat way to sum it up is that “When consumed in small amounts and with other healthy sources of calories, ultra-processed products are harmless; however, intense palatability (achieved by high content of fat, sugar, salt, and cosmetic and other additives), omnipresence, and sophisticated and aggressive marketing strategies (such as reduced price for super-size servings), all make modest consumption of ultra-processed products unlikely and displacement of fresh or minimally processed foods very likely (Monteiro 2013). 

    Michael Pollan takes drastic steps of attempting to forage, strictly buying locally and freshly farmed and raised foods (Pollan). While that is certainly not possible for everyone, something that anyone can take from Michael Pollan’s approach is that we should be more mindful about what we eat but also remember to savor our food a little more. For example, there has been a lot of discourse surrounding a TikTok creator named Nara Smith who goes by the handle @naraazizasmith. She started making foods from scratch because of her eczema and skin conditions that caused her to reconsider many of the foods she was consuming, and she now primarily creates videos of her creating many foods from scratch such as yogurt, ice cream, breads, etc. Many others commented on her videos especially about her portion control because she seemed to be very satisfied with the small amounts of treats, such as ice cream, that she gives herself. It was apparent to see that she savored every single bite of the ice cream that she made from scratch and that she was truly satisfied with everything that she ate. 

    An interesting thing that Michael Pollan notes is that food and cooking is not as valued today. More often than not it is seen as a chore which is easy to do when life is constantly busy and throwing curve balls at you from left and right. But isn’t it more satisfying eating something that you took the time to make yourself? Of course, it can be very taxing and difficult but without cooking, most of us don’t take the time to reflect upon what we are eating. Do we take the time to enjoy our food? Rather than needing to cook everything ourselves, I believe that it is up to us to set aside time to enjoy food thoroughly by eating with friends and family or by reflecting upon ourselves and the joys within our lives. The dilemma isn’t whether or not we consume meat but rather what we have as food for thought!

    Sources: 

    Mohanty, Sujit K., et al. “Bioethanol Production from Corn and Wheat: Food, Fuel, and Future.” Bioethanol Production from Food Crops, Academic Press, 24 Aug. 2018, www.sciencedirect.com/science/article/pii/B9780128137666000035?via=ihub#s0070. 

    Monteiro, C. A., et al. Ultra‐processed Products Are Becoming Dominant in the Global Food System – Monteiro – 2013 – Obesity Reviews – Wiley Online Library, onlinelibrary.wiley.com/doi/full/10.1111/obr.12107. Accessed 19 Apr. 2024. 

    Pollan, Michael. The Omnivore’s Dilemma: A Natural History of Four Meals. Penguin Group, 2006. 

    Smithsonian Institution. “Ancient DNA Continues to Rewrite Corn’s 9,000-Year Society-Shaping History.” Smithsonian Institution, 1 Jan. 1970, www.si.edu/newsdesk/releases/ancient-dna-continues-rewrite-corns-9000-year-society-shaping-history#:~:text=Some%209%2C000%20years%20ago%2C%20corn,a%20handful%20of%20stony%20kernels. 

  • Coloring Space Green

    Coloring Space Green

    “It appears a colonization of the moon could become a reality,” state Cornell University researchers R. W. Langhans and D. R. Dreesen hopefully in 1988 – and it would only be a “true colony [if] food could be produced” (Langhans and Dreesen, 1988).

    The quest for interplanetary travel and colonization is one that, in the modern day, remains far-fetched and distant. While governments and research organizations have landed robots on Mars and mapped much of the Moon, the dream of a permanent, or at least self-sustaining, Moon base is still far off in the distance. One of the largest barriers to that dream is the challenge of growing food in space.

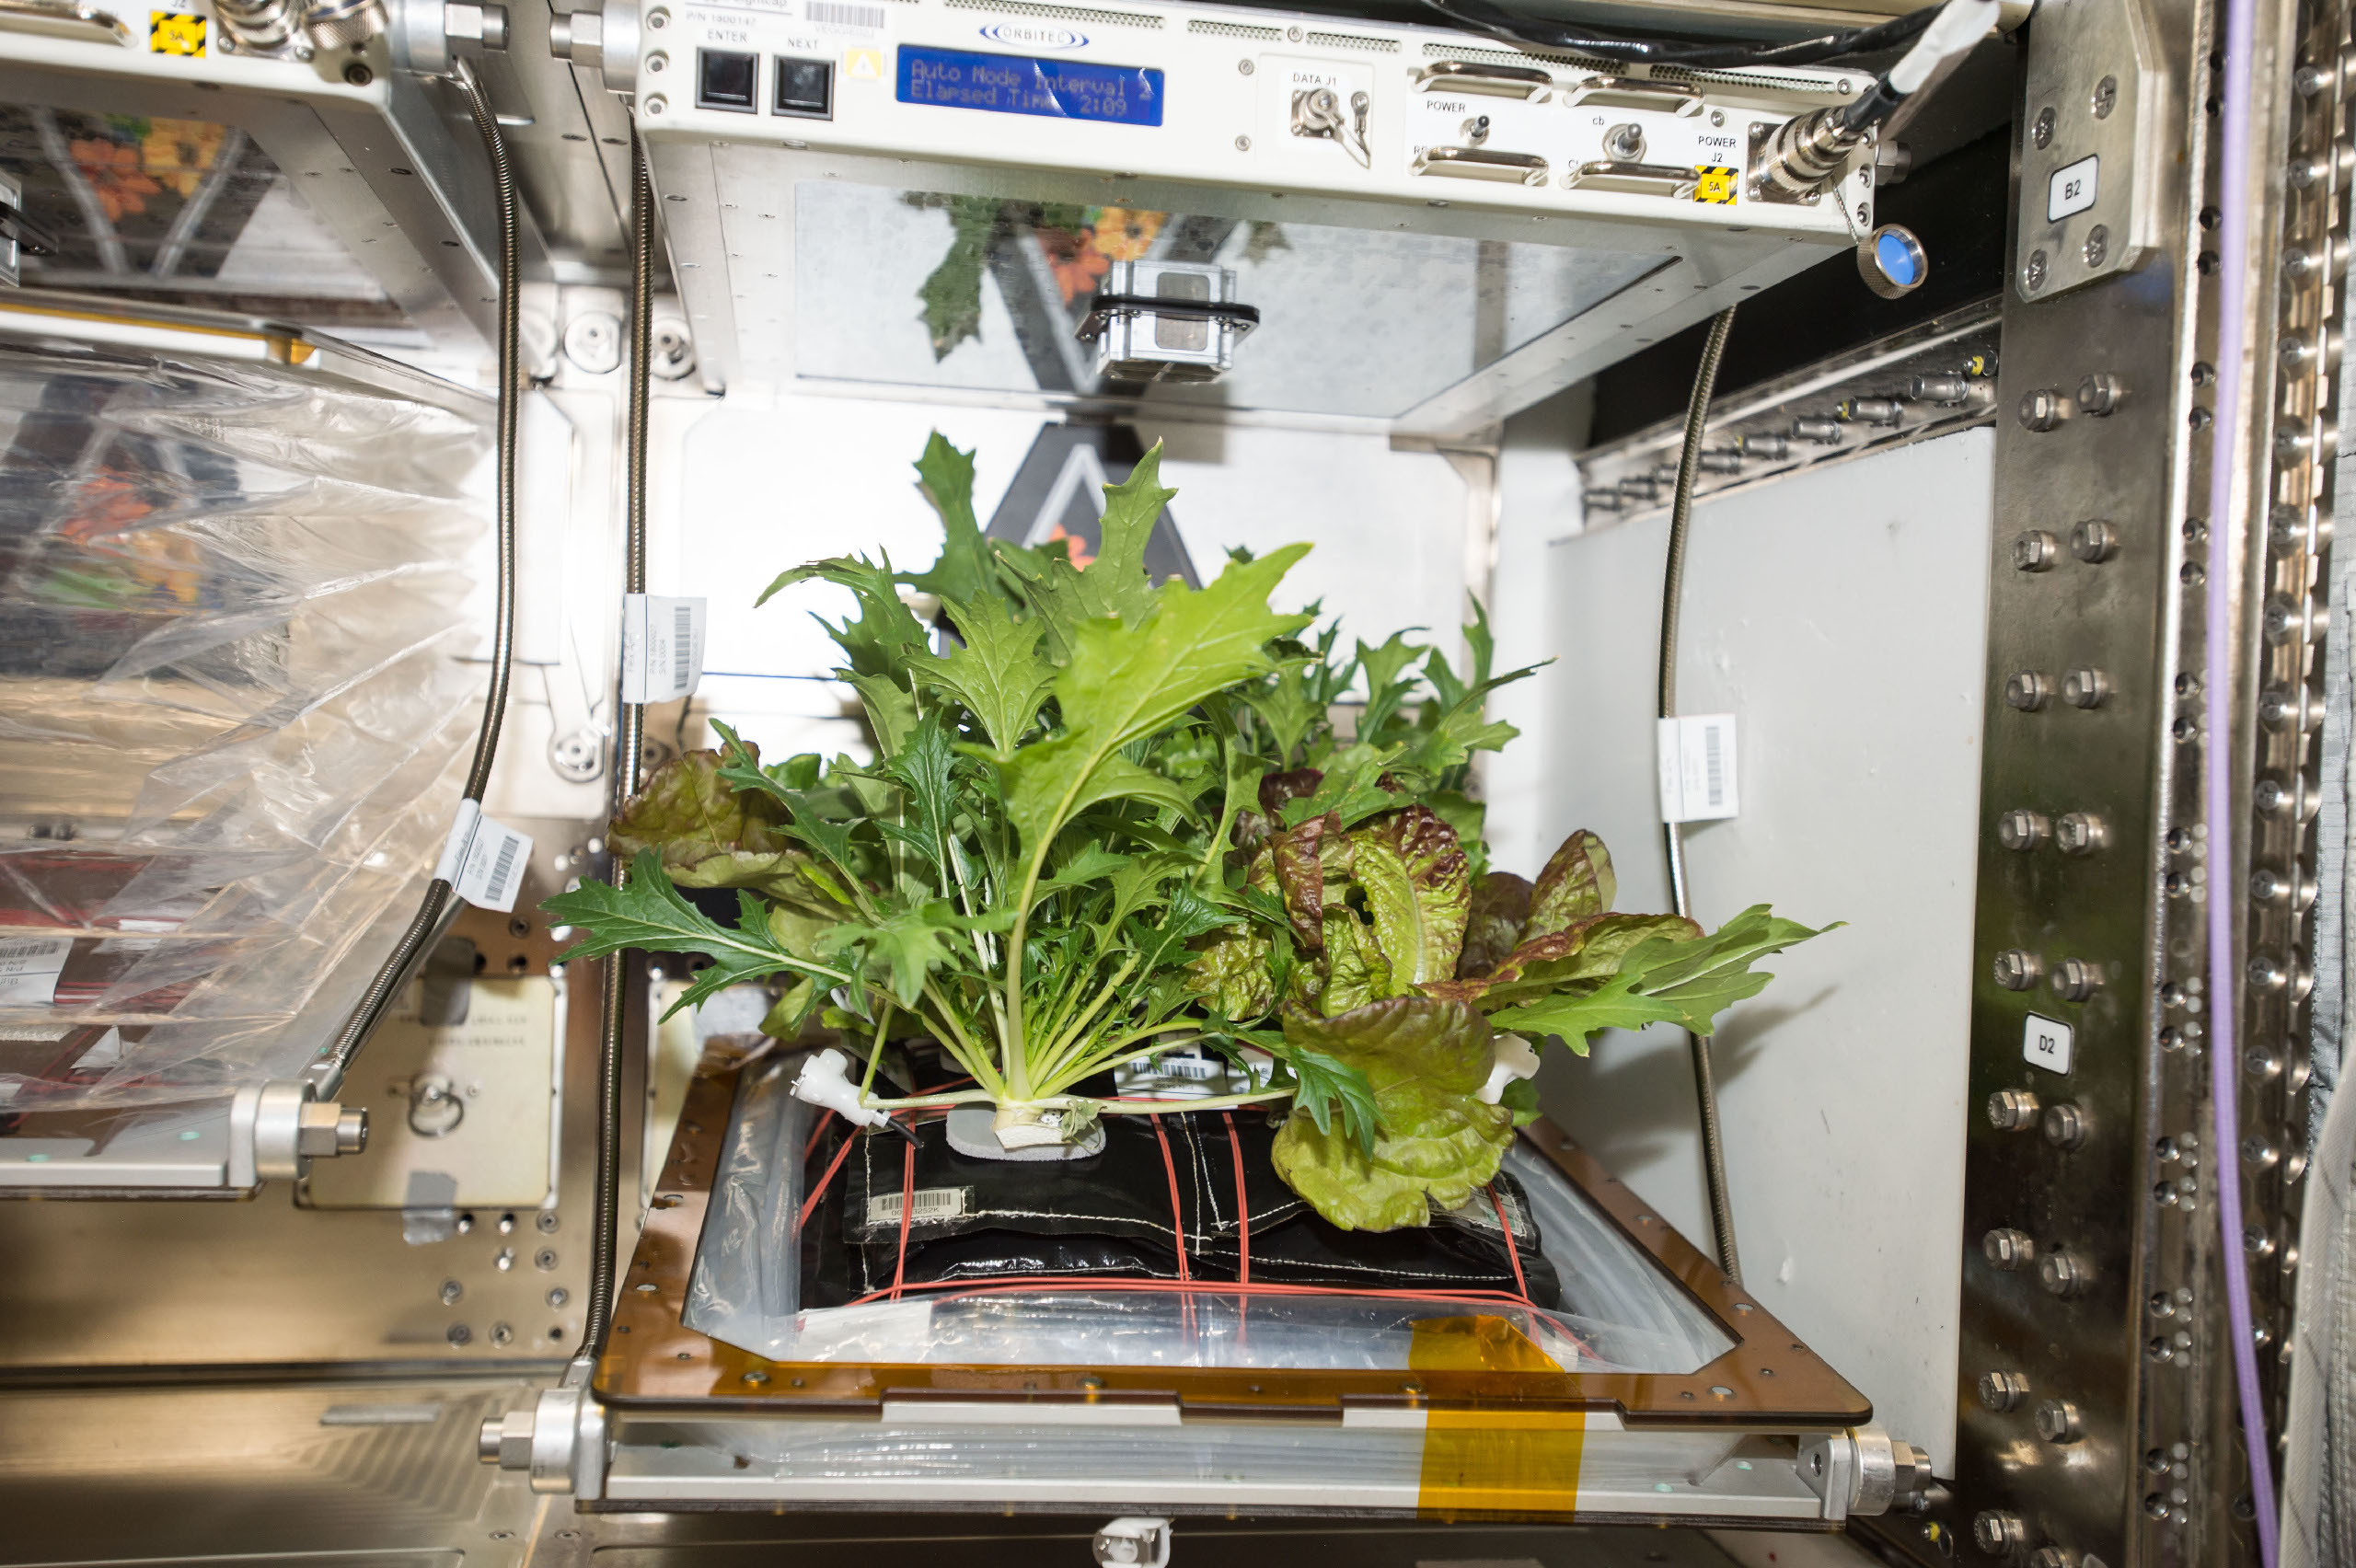
    Plants grown in space through NASA's Veggie system.

    Image Credit: NASA/ISS

    “The opportunities are exciting and almost unlimited in scope” (Langhans and Dreesen, 1988)


    Plant growth in space is challenging for a number of reasons due not only to the harsh conditions of space, but also the harsh design and engineering conditions of the spacecraft. Plants in space need to be able to survive radiation, microgravity, and low-light conditions, while also being physically compact, non-disruptive to the spacecraft’s oxygen and carbon-dioxide levels, and unable to produce excess waste, toxins, and dangerous microbes (Musgrave, 2008; Langhans and Dreesen, 1988; Reed and Vanden Bosch, 2023). Beyond those requirements, these compact space-grown plants must provide all the essential nutrients required for a human diet in the absence of animal products and larger plant products like large fruits (Langhans and Dreesen, 1988).

    While difficult, growing plants in space is extremely rewarding. NASA has determined that only eight species of plants – wheat, rice, white potato, sweet potato, soy bean, peanut, lettuce, and sugar beet – contain all the essential elements, carbohydrates, oils, and amino acids for a balanced human diet (Langhans and Dreesen, 1988). Vitamins, while not fully covered by these eight species of plants, can be supplemented for shorter missions, although they break down when prepackaged for longer ones (Langhans and Dreesen, 1988; and NASA, 2023). In addition, plants have been shown to be positively correlated with psychological well-being on Earth and in space (NASA, 2023). Plants then, are not only beneficial for the astronauts physical health, but their mental health too.

    Currently, NASA employs two growth habitats: the Vegetable Production System (nicknamed Veggie) and the Advanced Plant Habitat (APH) (NASA, 2023). Both Veggie and the APH use enclosed microbiomes with simulated radiance from LED lights and carefully controlled gas content, temperature, and moisture levels (NASA, 2023). While not all eight of the ideal plants identified in 1988 have been successfully grown, the advancements of Veggie, APH and other new technologies shine a light on a hopeful future of plant-filled space exploration.


    Credits

    Langhans, R. W., & Dreesen, D. R. (1988). Challenges to plant growing in space. HortScience, 23(2), 286-293.

    Musgrave, M. E. (2008). Growing plants in space. CABI Reviews. https://doi.org/10.1079/pavsnnr20072065

    NASA. (2023, December 8). Growing plants in space. NASA. https://www.nasa.gov/exploration-research-and-technology/growing-plants-in-space/

    Reed, D. W., & Vanden Bosch, C. A. (2023). Engineering perspectives of growing plants in space. Journal of the Indian Institute of Science, 103(3), 797–805. https://doi.org/10.1007/s41745-023-00369-6