The Pollinator Commeth!

It’s pollen season, and where I live in Atlanta Mother Nature has given everything with the misfortune to be outside a healthy dusting. Now that my car has the same greeny-yellow slime color of an abandoned pool I am resolved to do some digging into the phenomenon. However, I feel pollen is fairly well known natural event. It’s part of plants making baby plants and bees are involved. What else is there to know right? Well for starters, how are pollen levels measured? Pollen levels being the standard metric by which news organizations inform drugstores to stock up on tissues and anti-histamine. This concept has gotten my engineer-sense tingling…unless that’s just… Oh geez…

::Achoo!::

Just kidding. My immune system is like an impregnable fortress made of Dwarven forged mithril (the good stuff), but if you are one of the many people who suffer from pollen allergies (known collectively as allergic rhinitis AKA hay fever) you should take solace in the fact that science is on your side. Right now, on a rooftop somewhere in your area is a greased up rod spinning around in a tube that is sucking in air and pollen. This doohickey has the understandable but perhaps uninspired name of a “rotorod”. Air is sampled for a fixed interval, usually for one minute out of every ten minutes for a twenty-four hour period, and any pollen grains in the sampled air are stuck to a layer of silicone grease on the rotorod as they pass over its surface. After the sampling period a special staining solution that contains a dye designed to adhere preferentially to the surface of the pollen grains (and not for example on mold or dust also in the air) is put onto the rotorod localized pollen, and then a fixed area of the rotorod surface is observed under an optical microscope. By utilizing the fact that the sampling rate, volume of air sampled and observation area are all fixed the number of pollen grains on the observed area of the rotorod can be used to calculate the average concentration of pollen grains floating around in the air.

If your response to that last paragraph was, “Wait, somebody has to physically count every single pollen grain collected during the test AND because they are a good scientist and want to minimize the scatter in their data took multiple tests? I thought you said science was on MY side!” then I am right there with you friend o’ mine. Sounds like a lot of work, especially when automated particle counters exist to constantly measure the concentration and size of particulates in the air. These particle counters use either the blocking of light (for particles larger than about 1000 nanometers) or scattering of light (for particles around 50-500 nanometers) and with similar methodology to the rotorod and microscope method (known volume of sampled air at fixed sampling intervals) these devices can determine total particle concentrations and size distributions for a given volume of air. This type of sampling technique is commonly used to monitor the “cleanliness” of clean rooms used for semiconductor and satellite fabrication where even minor levels of contaminants can cause device failure. The best clean rooms have as few as one or less particle with a diameter of 500 nanometers in every cubic foot of air. As someone who has spent some time as a famous clean room technician (that’s me in the background!), and considering the fact that normal “dirty” room air has over a million particulates of the same size for every cubic foot, I can tell you these are some pretty clean rooms.
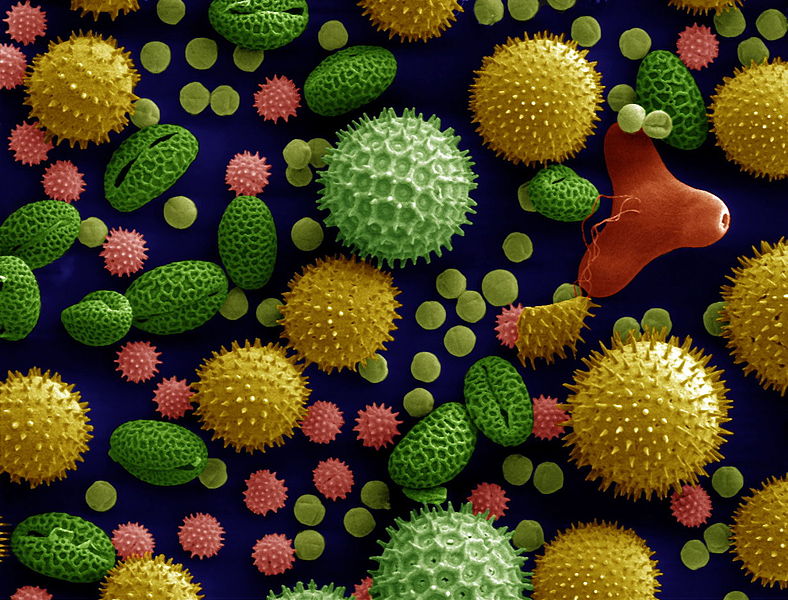
Images of pollen grains in SEM with false color added

One very important reason for not using this technique is the fact that pollens of different varieties imply different allergic responses for different people. Thus reporting a total pollen count or grain size distribution might not be an effective method to inform the public about the likelihood of a runny nose in their future which is the whole point of monitoring pollen levels in the first place. As a consequence, a trained specialist must identify both the species and concentration of pollen grains with the method described above which results in the reported “pollen count”. The myriad of sizes and shapes among different pollen grains, which macroscopically have very similar appearances, is shown in this false color image taken in a scanning electron microscope shown to the left. The original grey scale image (all SEM images are taken in grey scale) can be found here with call-outs to identify the pollen grains.

All of this finally brings us to the featured topic: the pollen count. From some sources only a value of high or low, moderate or severe or something of this nature is given, but this belies what we should now understand is a much more detailed piece of data from a very sensitive measurement system: a trained scientist. One source reported that the pollen count in Atlanta hit a record at over 9000 grains per cubic meter which seems like quite a lot, but not so bad when you consider the recent panic in Moscow when clouds of pollen from trees were so thick people thought they were toxic chemical fumes. Bonus points if you can spot the trained scientist in the video from Russia. With that knowledge, I’m feeling a little better about my car.


Leave a comment

Your journey starts here! Let’s talk!

ThemeRex © 2026. All rights reserved.
  Timothy Durham was convicted of rape when a test showed his DNA genotype matched the DNA recovered from the crime scene. Eye witnesses testified that Durham was in a different state at the time of the incident, but he wasn’t exonerated from his 3000 year sentence until follow up DNA analysis showed that the preliminary forensic analysis used in the trial was misinterpreted (Thomas et al.). DNA testing serves an invaluable part in our criminal justice system, but it comes with complications and bias that can lead to wrongful convictions and misinformed juries.  

Background:

Forensic genetics aims to identify the origin of a biological sample. It can be traced back to Karl Landsteiner who discovered human ABO blood groups. With blood groups, suspects could be eliminated based on their blood type. For example, if a suspect had type A blood and there was type B blood left at the scene by the perpetrator, the investigators could rule out the suspect. Unfortunately, the reverse didn’t work. If the suspect and perpetrator both had the same blood type, it can’t be concluded that the suspect was guilty. Blood identifiers evolved into 8 distinct categories which improved the ability to eliminate suspects, but could only conclude that (if the system matched) it might be the perpetrator or this person might be related to the perpetrator (Jobling and Gill). The field evolved in the 1980s with the discovery of Minisatellites, lines of repetitive DNA that don’t encode proteins. Minisatellite patterns in DNA create what we know today as the DNA fingerprint, and it has a much higher accuracy rate than previous methods (Augustyn et al.). Around the same time, a breakthrough for victims of sexual assault was discovered. In the case of assault, bodily fluids of both the victim and the assaulter can get mixed. A process called differential lysis was created which could selectively increase the concentration of sperm in a fluid sample thereby allowing for accurate DNA testing (Jobling and Gill). Forensics evolved to use single-locus probe testing after several years because of its ease of interpretation. It looked at specific minisatellites that had high variability between subjects. This was the first DNA-based method to be used in a criminal investigation. Two murder homicides from several years apart were connected using DNA evidence. The evidence was then used to exonerate an innocent man, and the guilty party was found when he tried to evade mandatory DNA testing for all men in the small town. His guilt was then reinforced when the DNA profiles matched, and he gave a confession (Jobling and Gill). Finding DNA at a crime scene doesn’t guarantee that you’ll find a murderer. There are issues with non-pure samples and limited samples that make DNA work difficult, and accreditation of facilities and new techniques and take time (Jobling and Gill).  

Subjectivity of DNA Interpretation:

In a 2009 publication, the National Academy of Science discusses the possibility for subjective influence in lab based forensics. The interpretation bias happens in complex cases where, for example, there could be a mixture of DNA. A study published in 2011 looked specifically at this issue. A gang rape happened in Georgia, and the mixture in DNA from the case was used to prosecute one suspect after another suspect took a plea bargain to testify against him. With DNA mixtures, there are three possible conclusions: suspect excluded, suspect cannot be excluded, and inconclusive. If the suspect is excluded, it means that there’s little to no possibility that his DNA is part of the sample. If the suspect cannot be excluded, it means that there’s a possibility that his DNA is part of the sample. In the trial, the DNA examiners who knew the context of the case concluded that the suspect being prosecuted could not be excluded. The 2011 study gave the DNA evidence from this case and the DNA profiles of the suspects to 17 forensic examiners. These examiners had no context of the case, and they all worked independently. Of the 17, only 1 came to the same conclusion (suspect cannot be excluded) as the examiners who knew the context of the case. Twelve of the 17 concluded that the suspect who was prosecuted and convicted had no relation to the DNA found in the sample. Not only does this show that subjectivity occurs due to the context of the case, but the 17 examiners came up with different findings based on their past experiences meaning that not all DNA analysis is objective. Some organizations like the Scientific Working Group on DNA Analysis Methods say that quantitative statistical evidence should be presented with every categorical conclusion, but the US doesn’t require this (Dror and Hampikian).

False Positives:

There are two categories that cause wrongful identification in a DNA report: coincidental matches and false positives. Coincidental matches are DNA matches between two unrelated people. The probability of these matches is about 1 to 500,000 for white individuals and about 1 to 350,000 for black individuals. This small probability of coincidental matches makes people feel confident in DNA evidence. False positives, on the other hand, are matches between DNA and test DNA that result from issues in the forensics lab. There have been multiple cases of forensics labs accidentally switching victim and suspected rapist DNA which lead to convictions that were later overturned when the lab realized the error. There are also cases of misreading or misunderstanding a sample. In a case from 1993, a man was convicted of rape because someone interpreted a mixed sample of victim and perpetrator DNA as an individual sample. The conviction was again overturned. To prevent false convictions, retesting DNA is allowed, but it’s not an efficient solution. Many people are pushing for statistical information on the probability of false positives, so that the jurors can make accurate judgements based on DNA evidence (Thomas et al.).  

Conclusion:

DNA analysis is a useful tool for the criminal justice system, but subjectivity can be an issue in forensic testing. To combat wrongful convictions, there are organizations like The Innocence Project who use DNA testing to free the innocent, but reformed forensic testing standards should be put in place to prevent subjectivity and to ensure juries are correctly informed during trials. https://www.innocenceproject.org/    

Citation:

Augustyn , Adam, et al. “DNA Finerprinting.” Encyclopedia Britannica , 26 Apr. 2018, www.britannica.com/science/DNA-fingerprinting#ref153186. Dror, Itiel E., and Greg Hampikian. “Subjectivity and Bias in Forensic DNA Mixture Interpretation.” Science & Justice, vol. 51, no. 4, 2011, pp. 204–208., doi:10.1016/j.scijus.2011.08.004. Jobling, Mark A., and Peter Gill. “Encoded Evidence: DNA in Forensic Analysis.” Nature Reviews: Genetics, vol. 5, no. 10, Oct. 2004, pp. 739–751., doi:10.1038/nrg1455. Thompson, William C, et al. “How the Probability of a False Positive Affects the Value of DNA Evidence.” Journal of Forensic Sciences, vol. 48, no. 1, Jan. 2003, pp. 1–8., doi:10.1520/jfs2001171.