Day: November 28, 2025

  • Music Influence in Daily Life

    Music Influence in Daily Life

    Have you ever heard that one’s emotions can be greatly influenced by music alone? Music can be used to manipulate the philosophy of a person from a young age. It can calm down or bring discomfort to an adult. Music is encoded into human traditions and cultures. 

    Patriotism in Culture

    It is known that since our ancestors’ time, education has been a fundamental part of the culture to nurture children into responsible and dependable adults. Borea’s area in the left hemisphere of the brain links to language and speech production. This is where music resides, hence music can evoke powerful emotions (Pianka, 2012). Professor Pianka (2012), an evolutionary ecologist, also criticized that music was exploited by leaders to arouse their people into wars, using national anthems to evoke patriotism and inflame tribal instincts. In fact, this does not only apply to soldiers, but also young children and working adults.

    In the book “Patriotism and Nationalism in Music Education”, many music education philosophers agree that music education is a medium of instilling patriotism in children (Hebert & Kertz-Welzel, 2016, p. 11). Take Taiwan for example, national identity is a sensitive issue that is strongly reflected in school curricula. The music curriculum is designed to promote students’ personal and national identities in the new Taiwan (Hebert & Kertz-Welzel, 2016, p. 67). In the past, corrupted politicians wanted to strengthen the relationship between citizens and their own country, which in turn would support their position in power. Fortunately, Hebert and Kertz-Welzel (2016, p. 40) noted that with the lesson from Germany, the time for music education as a means for nationalistic or patriotic education is over.

    In modern days, this situation occurs more in culture than politics. For example, Pianka (2012) suggests sports fans in opposing groups using their team’s theme song to elicit passion is a form of conflict influenced by music.

    Nature in Music

    Aside from childhood education, religion is part of many people’s lives, which feels incomplete without listening to the music and singing. Patrick Whelan, a Harvard Medical School lecturer, suggested that church music “puts everyone in the same emotional space” (Eck, 2024). 

    Whelan suspects this is due to evolutionary biology. Earliest nocturnal mammals had to rely on being hyperfocused and hyperattentive for survival, which likely adapted into live music today (Eck, 2024). The human brain can tag acoustic cues as familiar or unfamiliar. Church attendants have been listening to choir since their childhood, so indeed the music is familiar to them. Eck (2024) stated that “the valence of the music, which signals whether the music feels positive, negative, or somewhere in between, influences the autonomic nervous system (ANS)”, which can also be influenced by the familiarity of the music. This is the reason why a person can feel discomfort from listening to infamous or heavy metal music if they are growing up not familiar with the genre.

    Additionally, a study (Song et al., 2023) revealed that music familiar to nature sounds bring comfort, relaxation, and lower negative mood. The study suggests that despite most people now residing in urban areas, participants are more at rest with nature sounds than urban sounds. Song and others (2023) believe that the reason is due to how the ancestors have long been living with nature, while the accelerated industrialization and urbanization only occur in recent centuries. There’s a suggestion of inheritance involving music familiarity, though family environment can be a larger factor as Whelan suggests.

    Healing of the Brain

    Sometimes, music can be a cure. According to Eck (2024), there is growing evidence that “listening to Mozart’s Sonata for Two Pianos in D Major can reduce the frequency of seizures in some people with epilepsy”. Eck suggested that “by identifying the exact type of music able to provoke a particular cognitive, motor, or emotional response, there could be progress toward healing, improving, or compensating for disrupted brain function in various diseases.” However, further knowledge about this topic requires more research and may not provide concrete evidence in a few upcoming years. 

    Meanwhile, adults deal with a lot of stress nowadays. However, there is a lack of free mental healing resources. Relaxing music would be the best choice for most people. Interestingly, ASMR-triggering music is found to reduce stress equally as relaxing sounds like nature (Paszkiel et al., 2020). Visiting a natural environment is also a good option to relieve stress (Song et al., 2023). Since traveling is not a choice for busy people within cities, nature sounds (in addition to relaxing music) can easily be accessed through various platforms on the Internet.  


    References

    Eck, A. (2024, March). How music resonates in the brain. Harvard Medicine Magazine. https://magazine.hms.harvard.edu/articles/how-music-resonates-brain

    Hebert, D. G., & Kertz-Welzel, A. (2016). Patriotism and nationalism in music education. Routledge.

    Paszkiel, S., Dobrakowski, P., & Łysiak, A. (2020). The impact of different sounds on stress level in the context of EEG, cardiac measures and subjective stress level: A pilot study. Brain Sciences, 10(10), 728. https://doi.org/10.3390/brainsci10100728

    Pianka, E. R. (2012). Can Human Instincts Be Controlled?. Human instincts. http://www.zo.utexas.edu/courses/thoc/HumanInstincts.html

    picryl. (2017). Music melody musical note, music. picryl. Retrieved November 28, 2025, from https://picryl.com/media/music-melody-musical-note-music-93af15. Creative Commons CC0 1.0 Universal Public Domain Dedication license

    Song, I., Baek, K., Kim, C., & Song, C. (2023). Effects of nature sounds on the attention and physiological and psychological relaxation. Urban Forestry & Urban Greening, 86, 127987. https://doi.org/10.1016/j.ufug.2023.127987
  • Yanny or Laurel? The Sound that Divided the Internet

    Yanny or Laurel? The Sound that Divided the Internet


    Yanny or Laurel? The Sound that Divided the Internet

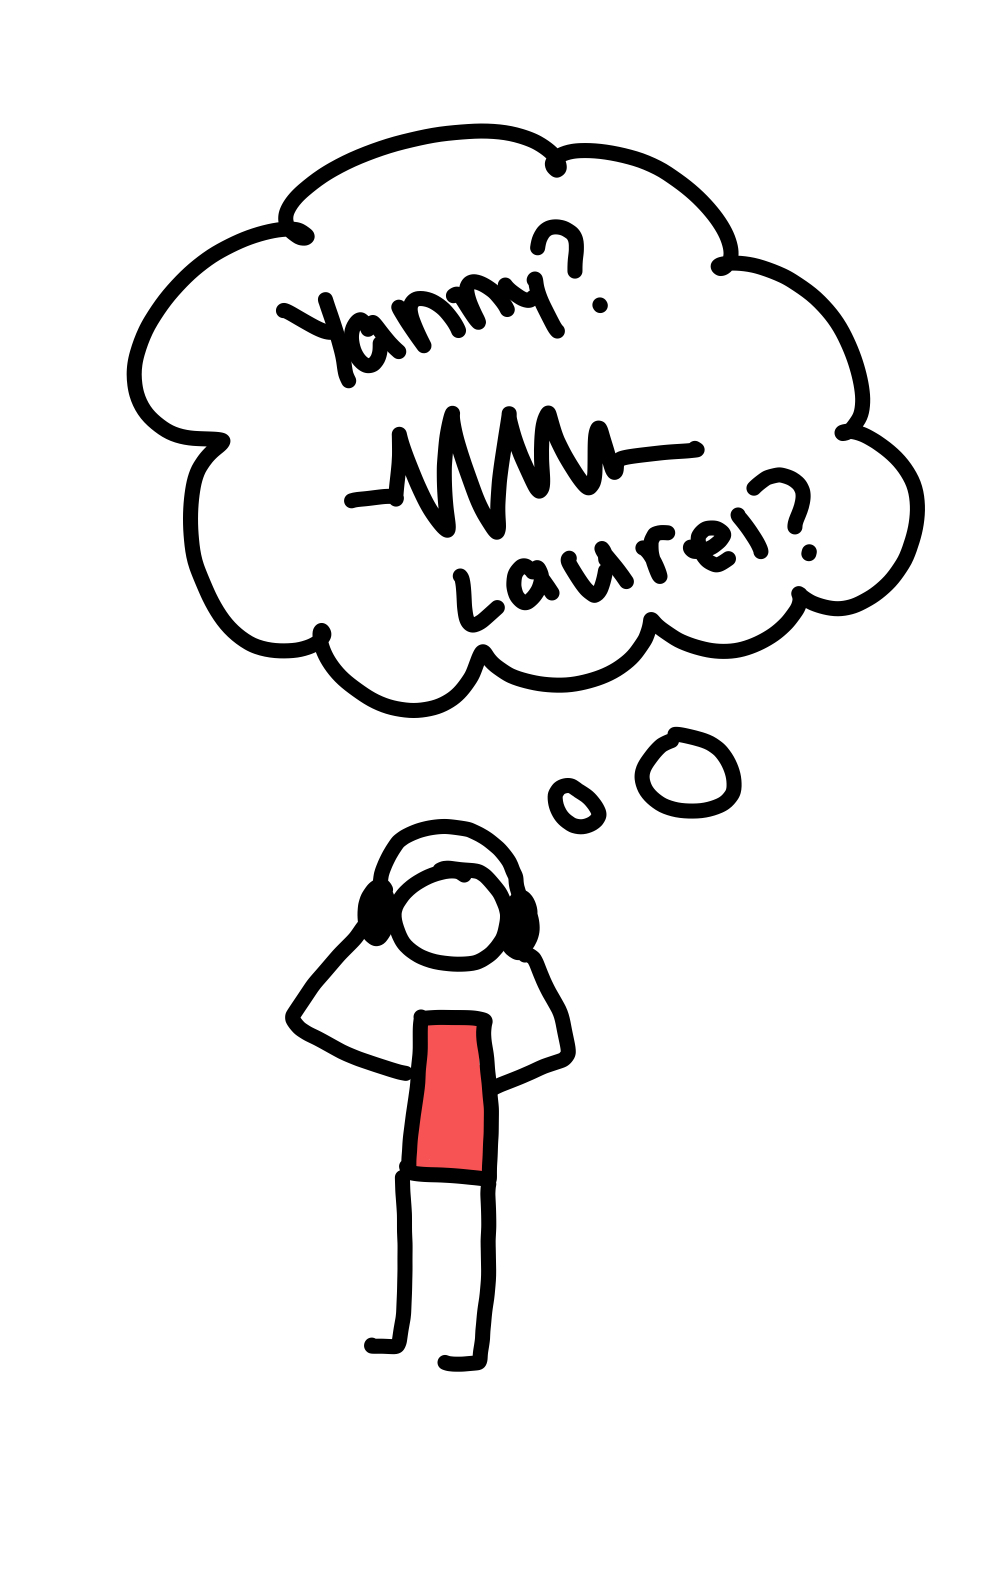
    One chaotic week in 2018, the internet was torn apart by one singular audio clip. Two syllables, repeated over and over, sparked worldwide confusion. I was a voice saying “Yanny” or “Laurel”. If you ask me, I heard Yanny on my first listen, but now I can easily switch between the two (unlike the dress mentioned in one of my previous posts). I am here once again to talk about how the same audio can be interpreted differently by ears around the world, the same way one picture of a dress can be interpreted differently by eyes around the world.

    In my article about “The Dress,” I related the function of our visual system to a camera. I clarified that the eyes do not record everything like a camera, but use context and past experience to interpret visual cues. Similarly, our ears do not hear everything like a microphone. They interpret input based on frequencies and expectations, which can also change as we age.

    Hearing isn’t always believing.

    Sound waves are interpreted by entering the eardrum, travelling to the inner are, and activating hair cells. The auditory cortex in your brain constructs what you hear based on the activation patterns of your hair cells, past experiences, and the sensitivity of your ears, all of which can differ from each individual (Moore 2012).

    When people hear different words in the audio clip, it is caused by the brain forming different perceptions of the same signal, not personal preference.

    The Science Behind It

    The audio clip contains a mixture of frequencies. When analyzed, it was found that there were frequencies at both the low range (400-500 Hz) and high range (2500-300 Hz) in the audio clip (Rosen 2018). People who hear “Laurel” tend to emphasize lower frequencies, while people who hear “Yanny” tend to emphasize high frequencies (Rosen 2018). This is similar to “The Dress,” where people who saw each color set had a different preference for color undertones.

    Presbycusis is a phenomenon that causes people to lose sensitivity to upper ranges of audio frequency as they age, causing a physical variation in how people hear (Gates et. al., 2006). Since “Yanny” is encoded in high-frequency sounds, it is more likely for it to be heard by younger people (like me!).

    Surveys have shown that it was more likely for older adults to hear “Laurel” due to its lower frequencies. These frequencies are more stable throughout one’s lifespan.

    Why does the brain choose one word over the other?

    Top-down processing is when the brain uses existing knowledge and experience to interpret sensory information, instead of letting the sensory information motivate the interpretation. This type of processing is important for interpreting ambiguous sounds such as this one (Hickok & Poeppel, 2007). If your brain is used to certain vowels or speech patterns, you may hear a specific word. For example, more American English speakers heard “Laurel” because the low-frequency format is common in American English, while listeners who spoke a language with a higher-frequency format were more likely to hear ‘Yanny’ (Samuel, 2011).

    What does this reveal?

    Our brain does not perceive all the senses the same way as everyone else! Hearing sounds that are ambiguous forces our brain to guess, and not all brains guess the same way.

    References

    Gates, G. A., & Mills, J. H. (2005). Presbycusis. The Lancet, 366(9491), 1111–1120. https://doi.org/10.1016/S0140-6736(05)67423-5

    Hickok, G., & Poeppel, D. (2007). The cortical organization of speech processing. Nature Reviews Neuroscience, 8(5), 393–402. https://doi.org/10.1038/nrn2113

    Moore, B. C. J. (2012). An introduction to the psychology of hearing (6th ed.). Brill.

    Rosen, J. (2018). The science behind Yanny vs. Laurel: Why we hear what we hear. The Journal of the Acoustical Society of America, 144(1), 62. https://doi.org/10.1121/1.5052025

    Samuel, A. G. (2011). Speech perception. Annual Review of Psychology, 62, 49–72. https://doi.org/10.1146/annurev.psych.121208.131643


  • The Mystical World of Gluten Free Labeling – is it Lying?

    The Mystical World of Gluten Free Labeling – is it Lying?

    Odds are, as a consumer you’ve likely glanced at a food label in your lifetime. Though, for some, more than a quick glimpse is necessary, as the intricate details can be the difference between health or illness. This really applies to any allergy, as ingredients and wording can easily veil allergens. Specifically, this can be a regular practice for those avoiding gluten, as just a microscopic amount can have macroscopic repercussions. 


    What is gluten?

    Gluten is a protein found in wheat, primarily present as gliadin and glutenin. Synonymous proteins are present in rye as secalin, barley as hordein, and oats as avenins (Biesiekierski, 2017). Gluten is used as an umbrella term to describe each of the proteins, as each behave and interact in similar ways. Most commonly found in breads, pastas, and other dough based products, gluten acts as a binding agent. This means its presence impacts texture, elasticity, and even taste (Biesiekierski, 2017). These factors cause gluten to be found in less obvious products like seasonings, dressing, and even the remoistenable seal of an envelope. 


    To be or to not be free of gluten

    With the possibility of gluten being present in so many different forms, tracking its presence is crucial for those trying to avoid it. As declared by the Food and Drug Administration, for something to be labeled gluten free it must meet specific criteria to be considered not misbranded. The official ruling defines ‘gluten free’ as an item that doesn’t have a gluten containing grain, is not derived from a gluten containing grain, and an item with less than 20 parts per million of gluten (ppm) (Food and Drug Administration, 2013). The parts per million decree is pertinent when a gluten containing grain has been specifically adapted to contain not gluten. It essentially means that for every 1,000,000 grams of a substance, less than 20 of them are able to actually contain gluten. This microscopic amount pales in comparison to a single bread crumb or speck of flour, causing issue to another form of gluten possession, cross contamination. 


    Items naturally free of gluten such as meat or rice cannot confidently be deemed gluten free due to cross contamination. Cross contamination occurs when one substance is unknowingly transferred to another, in this case that substance is gluten. Transfer of gluten from a containing substance to supposedly gluten free product can happen at any point in the development process of a product (Damasceno et al., 2024). A single speck of wheat flour would be enough to contaminate a gluten free product. This means shared equipment, such as a conveyor belt holding glutenous food being used on a gluten free product could easily result in the surpassing of the 20 ppm maximum.


    External Certifications

    Beyond just an FDA approved gluten free marking on a product, there are many different types of certifications that may each follow their own thresholds for what is considered gluten free. Globally, these 3rd party certification processes vary in their guidelines to be included, with different organizations such as Beyond Celiac’s ‘Gluten-Free Certification Program’, Gluten Intolerance Group’s ‘Certified Gluten Free’ Stamp, or National Celiac Association’s gluten free certification. Each of these listings require different ppm of gluten, with one even having a maximum of 5 ppm, which is significantly lower than the FDA regulation (Dennis, 2018). The certifications can provide more comfort to consumers avoiding gluten, as they require more extensive testing of the products to confirm their gluten ppm. While the FDA decree sets limits for a company to legally consider its product gluten free, it does not necessarily require the manufacturer to test the product to confirm that (Thompson & Simpson, 2014). 


    How to Read a Label – A Guide from First Hand Experience

    As someone with Celiac Disease, with its only treatment being a strict gluten free diet, over the past 9 years of my diagnosis I’ve learned a few tricks along the way. Most notably, I would say being a conscious consumer has been the most impactful thing for my safety when selecting food items. If a product does not have a specific certification, meaning it is  just generally labeled gluten free or has no label at all, my first step is to read the ingredients. In my experience, there are a few specific keywords to look out for. In the process of scanning an ingredient list, if I notice words like wheat, barley, malt, or rye, off the bat the product can be considered not gluten free. Additionally, gluten can be hidden in certain ingredients like corn syrups, oats, yeasts, and some seasonings. These items aren’t inherently glutenous, but particular processes may make them unsafe. 


    In some cases, a search online is beneficial for me as well. Frequently, even though a label does not guarantee an item to be gluten free, the company will disclose on their website that their products are free of gluten. Oftentimes, the company will not officially disclose anything due to concern for cross contamination. The actual extent to which this is possible though varies by company. This is where the list at the bottom of a product saying ‘may contain wheat’ is notable. For some, ‘may contain’ could mean direct use of shared equipment, but for others it’s a disclaimer that the factory also makes gluten items. Research or contact with the company is sometimes the best option as it clarifies this uncertainty, and allows for a decision by the consumer depending on the extent of the allergy/sensitivity. Lastly, an item cannot just be deemed gluten free if it lacks a note saying it ‘contains wheat’, as that does not ensure it does not contain barley or rye, which are also gluten containing grains. 


    References

    Biesiekierski, J. R. (2017, February 28). What is gluten? – biesiekierski – 2017 – Journal of Gastroenterology … Wiley Online Library. http://onlinelibrary.wiley.com/doi/10.1111/jgh.13703/full

    Damasceno, R. P. B., Zandonadi, R. P., Mendes, M., Cunha Junior, L. C., Raposo, A., Teixeira-Lemos, E., Chaves, C., & Farage, P. (2024, April 18). Risk of gluten cross-contamination due to food handling practices: A mini-review. MDPI. https://www.mdpi.com/2072-6643/16/8/1198

    Dennis, M. (2018). Third Party certification of Gluten Free Foods. BIDMC of Boston. https://www.bidmc.org/centers-and-departments/digestive-disease-center/services-and-programs/celiac-center/celiacnow/nutrition-and-the-gluten-free-diet/label-reading/third-party-certification-of-gluten-free-foods

    Food and Drug Administration. (2013, August 5). Food Labeling; Gluten-Free Labeling of Foods. Federal Register – National Archives. https://www.federalregister.gov/documents/2013/08/05/2013-18813/food-labeling-gluten-free-labeling-of-foods

    Thompson, T., & Simpson, S. (2014, October 1). A comparison of gluten levels in labeled gluten-free and certified gluten-free foods sold in the United States. Nature News. https://www.nature.com/articles/ejcn2014211 

  • The Dress that Broke the Internet

    The Dress that Broke the Internet


    The Dress that Broke the Internet

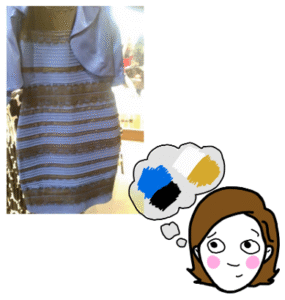
    I’m sure everyone has heard of this dress before, right? If you are not familiar, the picture of this dress went viral a few years ago because everyone on the internet could not agree whether it was blue and black or white and gold in color. If you ask me, I would say I see white and gold. How is it possible that we all look at the same picture but see completely different colors?

    Seeing isn’t always believing

    But why is this true? Why is everyone seeing this picture differently? Instead of recording the world like a camera, our brain actively interprets what we see using light, context, and past experiences (Foster 2011).  I’m here to talk about the neuroscience behind perceptions and why different people see different colors in the same picture.

    Battle of the Brain

    Studies have shown that there are stark individual differences in how people see color (Lafer-Sousa  2015). For example, how I define “red” is not the same way you define “red.” One specific study looked at which wavelengths of light were recognized in people who looked at the picture of the dress. People who prefer a more illuminating light, like a blue sky, saw white and gold because they were recognizing shorter wavelengths of light. On the other hand, people who favor warm light see blue and black because they see the longer wavelengths of light (Lafer-Sousa 2015).

    Can you see it both ways?

    Now that you know that people see both color schemes, are you able to see the other one? Personally, I am only able to see white and gold. Other people can switch between white & gold and blue & black. The quality of being able to switch between your perceptions is called a multistable image. Most of the people who are able to switch between the two color schemes in this picture have a background in art, so they are well-experienced in different color perceptions (Lafer-Sousa 2017).

    References

    Foster, D. H. (2011). Color constancy. Vision Res, 51(7), 674–700. https://doi.org/10.1016/j.visres.2010.09.006

    Lafer-Sousa, R., Hermann, K. L., & Conway, B. R. (2015). Striking individual differences in color perception uncovered by ‘the dress’ photograph. Current biology : CB, 25(13), R545–R546. https://doi.org/10.1016/j.cub.2015.04.053

    Lafer-Sousa, R., & Conway, B. R. (2017). Journal of Vision, 17(2), 25. https://doi.org/10.1167/17.2.25

  • The Magic of Cake Mix

    The Magic of Cake Mix

    When I was first learning to bake, I always wondered what was so special about ready-made mixes. In my mind, cake really wasn’t that complicated. Most cake recipes that I found online always called for some combination of flour, sugar, eggs, salt, and butter. So, why was it that the boxed cake mix always resulted in the same, consistent success, while baking from scratch yielded uncertain results?

    What is in Cake Mix?

    Cake mix is a box of conveniently measured out dry ingredients. All the baker needs to do is add eggs, some kind of fat, like oil, and a liquid, like water or milk. But what exactly makes up those dry ingredients?

    According to the Betty Crocker website, their yellow cake mix consists of quite recognizable ingredients, including flour, sugar, corn syrup, baking soda, and corn starch. These match the ingredients one could think of in a normal recipe. The flour makes up most of the cake, while the sugar and corn syrup are for sweetness. The baker would add in the water, eggs, and fat (vegetable oil) on their own, so the question lies in the rest of the ingredients. 

    The Extra Additives

    The rest of the ingredients of the Betty Crocker yellow cake mix make up less than 2% of the ingredients. However, they are extremely important to the stability of the cake. According to the label, these ingredients are monoglycerides, dicalcium phosphate, sodium stearoyl lactylate, xanthan gum, and cellulose gum. These ingredients are additives that help maintain the texture, stability, and shelf life of the mix. 

      • For instance, dicalcium phosphate is a tasteless, odorless additive that is usually included along with flour. It is meant to break up the ingredients evenly in the baking process and improve the consistency of the flour (Enax et al., 2022).
      • Additionally, sodium stearoyl lactate is an additive that is also used as a stabilizer and emulsifier in processed foods (FAO & WHO, 1996). As a stabilizer, its job is to make sure that the food’s texture and taste maintain their quality during extended times on the shelf. As an emulsifier, its job is to allow ingredients like oil and water to mix together.
      • Xanthan gum is also an ingredient commonly used in both food, polishes, and cleaners. Its job is to act as a stabilizer and thickener in convenience foods. More specifically, its job is to retain moisture in bakery goods and trapping gas in ready-made cake mixes so that they bake better (Katzbauer, 1997). 

    These are just a few of the extra ingredients that make cake mixes as consistent and convenient as they are today. They hold the ingredients together, enhance the taste and texture of the cake, and ensure that the results are similar each time. So, while, yes, cake mix is essentially the same mixture of flour and sugar than one might expect to find in a regular cake, there is a bit of science involved to help make sure it’s a bit easier each time!


    References

    Betty Crocker (n.d.). Betty Crocker Favorites Super Moist Yellow Cake Mix, Holiday Baking, 13.25 oz https://www.bettycrocker.com/products/betty-crocker-baking-and-cake-mixes/yellow 

    Enax, J., Meyer, F., Schulze Zur Wiesche, E., & Epple, M. (2022). On the Application of Calcium Phosphate Micro- and Nanoparticles as Food Additive. Nanomaterials (Basel, Switzerland), 12(22), 4075. https://doi.org/10.3390/nano12224075 

    FAO & WHO. (1996). SODIUM STEAROYL-2-LACTYLATE. Joint FAO/WHO Expert Committee on Food Additives (JECFA) Monographs. https://www.fao.org/fileadmin/user_upload/jecfa_additives/docs/Monograph1/Additive-424.pdf 

    Katzbauer, B. (1997). Properties and applications of xanthan gum. Polymer Degradation and Stability, Vol, 59, Iss. 1–3, https://doi.org/10.1016/S0141-3910(97)00180-8 

    Maehasi, N (2020). My very best Vanilla Cake – stays moist 4 days! https://www.recipetineats.com/my-very-best-vanilla-cake/ 

  • How We Can Detect Forest Fires from Space

    How We Can Detect Forest Fires from Space

    Wildfire seasons are becoming longer and more intense, and the speed at which a fire is detected can determine how much damage it ultimately causes. To improve early detection, researchers and government agencies are turning to an unexpected tool: satellites equipped with advanced thermal sensors and AI-powered alert systems.

    Modern Earth-observation satellites can detect tiny temperature changes on the planet’s surface- sometimes only a few degrees above normal. When a hotspot appears in a remote forest or grassland, the satellite sends the data to a processing center, where algorithms analyze the signal to determine whether it is likely to be a wildfire, a controlled burn, or simply a patch of warm ground. This automated screening filters out false alarms and helps firefighters focus on genuine threats.

    One major advantage of satellite detection is coverage. Traditional lookout towers or reporting systems depend on someone nearby noticing smoke. Satellites, however, pass over the same region several times a day, and some specialized systems- like Europe’s Sentinel satellites or NASA’s FIRMS platform- can relay updates within minutes. In regions that are difficult to access by road, this can mean the difference between a quick response and a fire that grows out of control.

    The technology is also becoming increasingly accessible. Fire agencies, environmental groups, and even school programs now use public satellite dashboards to monitor hotspots in real time. Students studying climate science can open a web browser and watch how temperature, drought, and vegetation patterns influence fire risk across entire continents.

    Still, satellite monitoring has limitations. Heavy clouds, dense smoke, or short revisit times can delay detection. That’s why many regions combine satellite data with drones, ground sensors, and local reporting networks. Together, these tools create a layered system- one that aims to spot fires earlier, respond faster, and ultimately protect more people and ecosystems.

    As climate patterns shift, the need for rapid wildfire detection is only growing. Satellite technology is becoming a crucial part of the solution, offering a high-tech way to monitor the planet and catch fires before they spread.


    Works Cited

    European Space Agency. “Sentinel-3: The Mission.” ESA, 2023, https://www.esa.int/Applications/Observing_the_Earth/Copernicus/Sentinel-3.

    NASA. “FIRMS: Fire Information for Resource Management System.” NASA Earthdata, 2023, https://firms.modaps.eosdis.nasa.gov/.

    NASA. “How NASA Detects Wildfires From Space.” NASA Earth Observatory, 2022, https://earthobservatory.nasa.gov/features/Wildfires.

    Schroeder, Wilfrid, et al. “The New VIIRS 375 m Active Fire Detection Data Product.” Remote Sensing, vol. 6, no. 7, 2014, pp. 7125–7149. MDPI, https://doi.org/10.3390/rs6077125.

    United States Forest Service. “Early Detection of Wildfires Using Satellite Data.” USDA Forest Service, 2021, https://www.fs.usda.gov/research/.

  • The Microscope that can Think by Itself

    The Microscope that can Think by Itself

    Artificial-intelligence technology is beginning to transform one of the oldest tools in science: the microscope. Researchers at institutions such as UCLA and Caltech are developing AI-powered microscopes capable of analyzing samples in real time, flagging unusual cells, and helping scientists diagnose diseases faster and more accurately.

    These advanced systems work by capturing high-resolution images and sending them through trained deep-learning models. When a researcher places a slide under the lens, the AI quickly scans thousands of cells, highlighting features that may indicate infection, cancer, or other abnormalities. Instead of relying solely on painstaking manual examination, scientists can use the AI’s suggestions as a guide, focusing their attention where it matters most.

    Early results have been promising. In several studies, AI-assisted microscopes identified harmful bacteria and subtle cellular changes at speeds that outperform traditional methods. Some algorithms were even able to detect patterns that are difficult for the human eye to notice, offering a powerful complement to expert analysis.

    What makes this technology especially impactful is its potential beyond major research hospitals. Schools, community clinics, and field labs could all benefit from microscopes that combine affordable hardware with intelligent software. Students learning cell biology could see the AI outline abnormal cells as they appear, while clinicians in resource-limited areas could diagnose infections more quickly and with improved accuracy.

    However, researchers emphasize that AI is not replacing human expertise. The algorithms must be trained carefully, and scientists still play a critical role in verifying results and preventing misclassification. The goal is not to remove humans from the process, but to strengthen diagnostic tools and make high-quality analysis more widely accessible.

    As AI continues to advance, the role of the microscope is shifting from simple magnification to intelligent interpretation. This fusion of computation and biology has the potential to accelerate diagnosis, improve education, and bring powerful analytical tools to places that need them most.


    Works Cited

    Ozcan, Aydogan, and Yibo Zhang. “Artificial Intelligence–Powered Optical Microscopy and Its Applications.” ACS Photonics, vol. 6, no. 11, 2019, pp. 2729–2741. American Chemical Society, https://doi.org/10.1021/acsphotonics.9b01029.

    Rivenson, Yair, et al. “Deep Learning Microscopy.” Optica, vol. 4, no. 11, 2017, pp. 1437–1443. Optical Society of America, https://doi.org/10.1364/OPTICA.4.001437.

    Zhang, Yibo, et al. “Pathologist-Level Interpretation of Microscope Images Powered by Deep Learning.” Nature Biomedical Engineering, vol. 3, 2019, pp. 1207–1215. Nature Publishing Group, https://doi.org/10.1038/s41551-019-0362-y.

    Caltech. “AI Microscope Can Help Diagnose Diseases in Real Time.” Caltech News, 3 May 2022, https://www.caltech.edu/about/news/ai-microscope-can-help-diagnose-diseases.

    University of California, Los Angeles (UCLA). “UCLA Engineers Develop AI-Powered Microscope to Automatically Detect Bacteria.” UCLA Newsroom, 12 Mar. 2020, https://newsroom.ucla.edu/releases/ai-microscope-bacteria-detection.