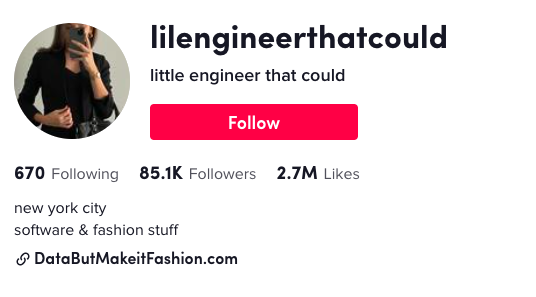
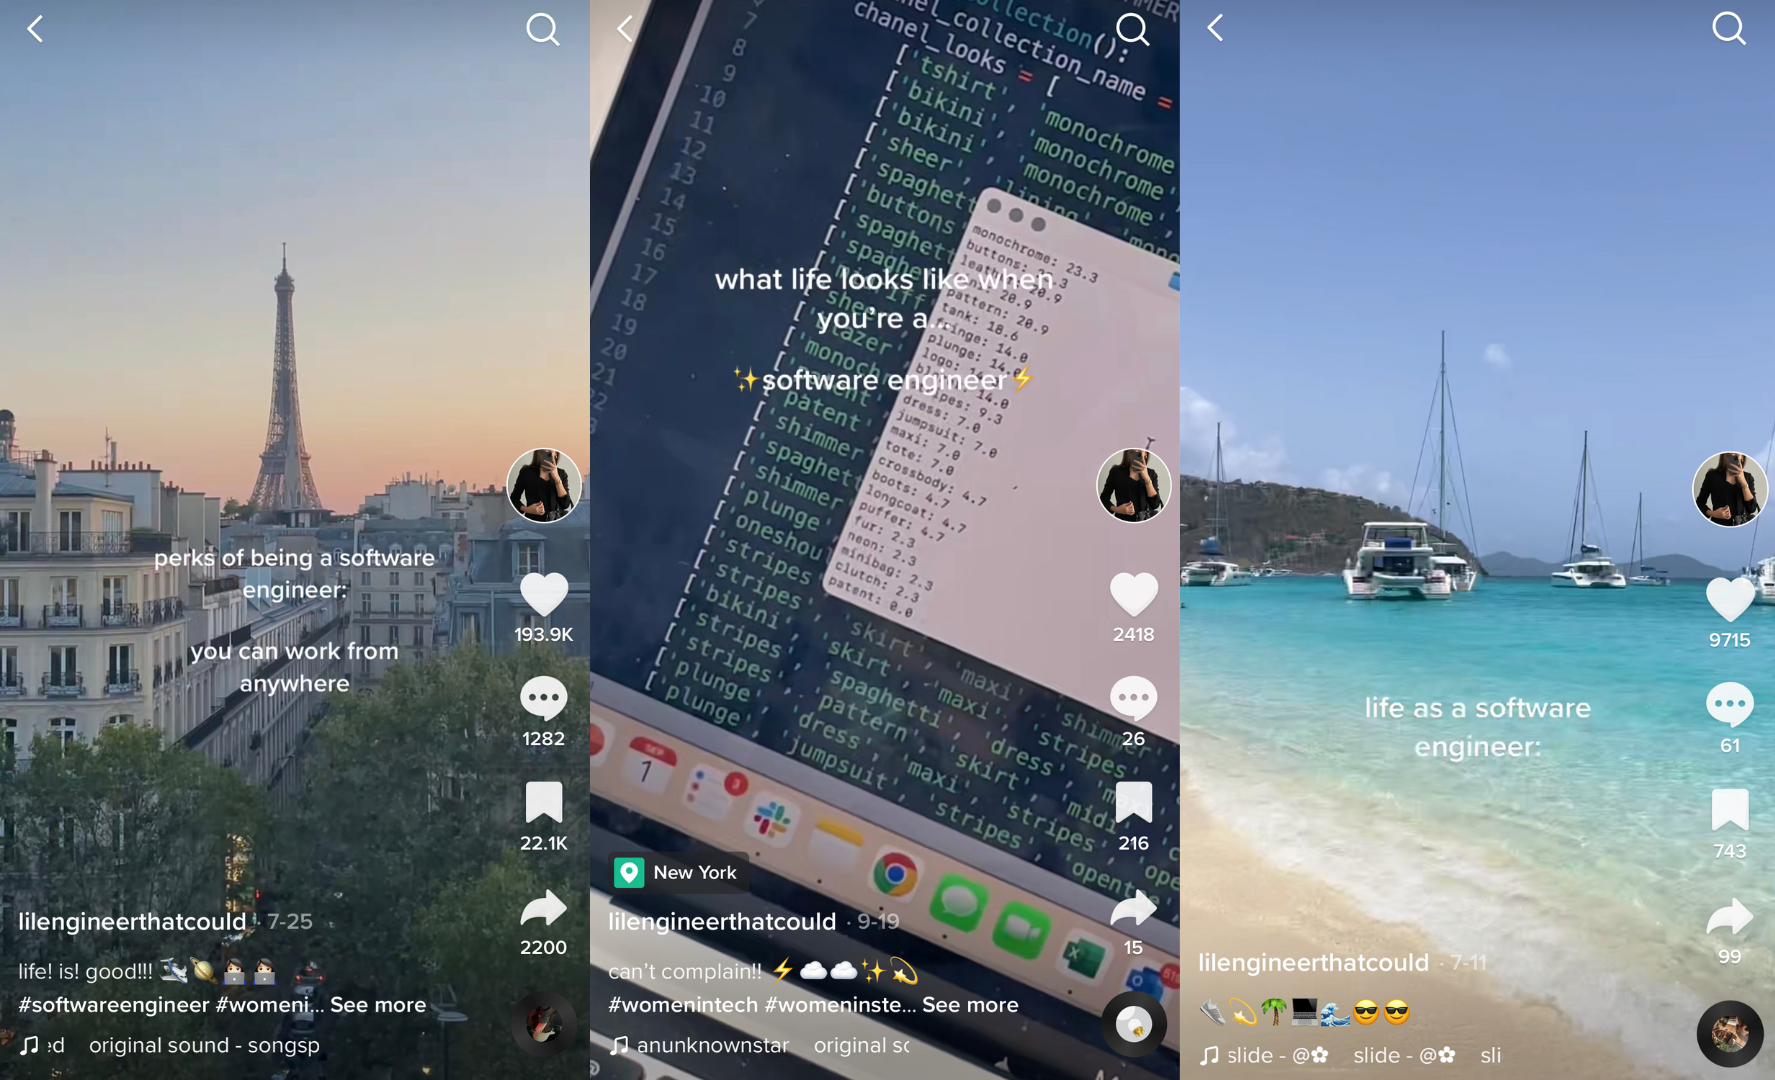
I found Madé Lapuerta’s TikTok account (@lilengineerthatcould) a few months ago, and as a computer science major who, like many others, doesn’t necessarily want to be working in a stuffy corporate office every day glued to a monitor, I immediately became anticipatorily jealous. Her videos feature her life as a software engineer, but instead of an apartment in Silicon Valley as one would imagine, her TikToks show picturesque photographs of iced lattes in front of the Eiffel Tower, magazines and perfume bottles laid out on her desk, airplane window sunset photos, and clips of her walking around the Louvre.
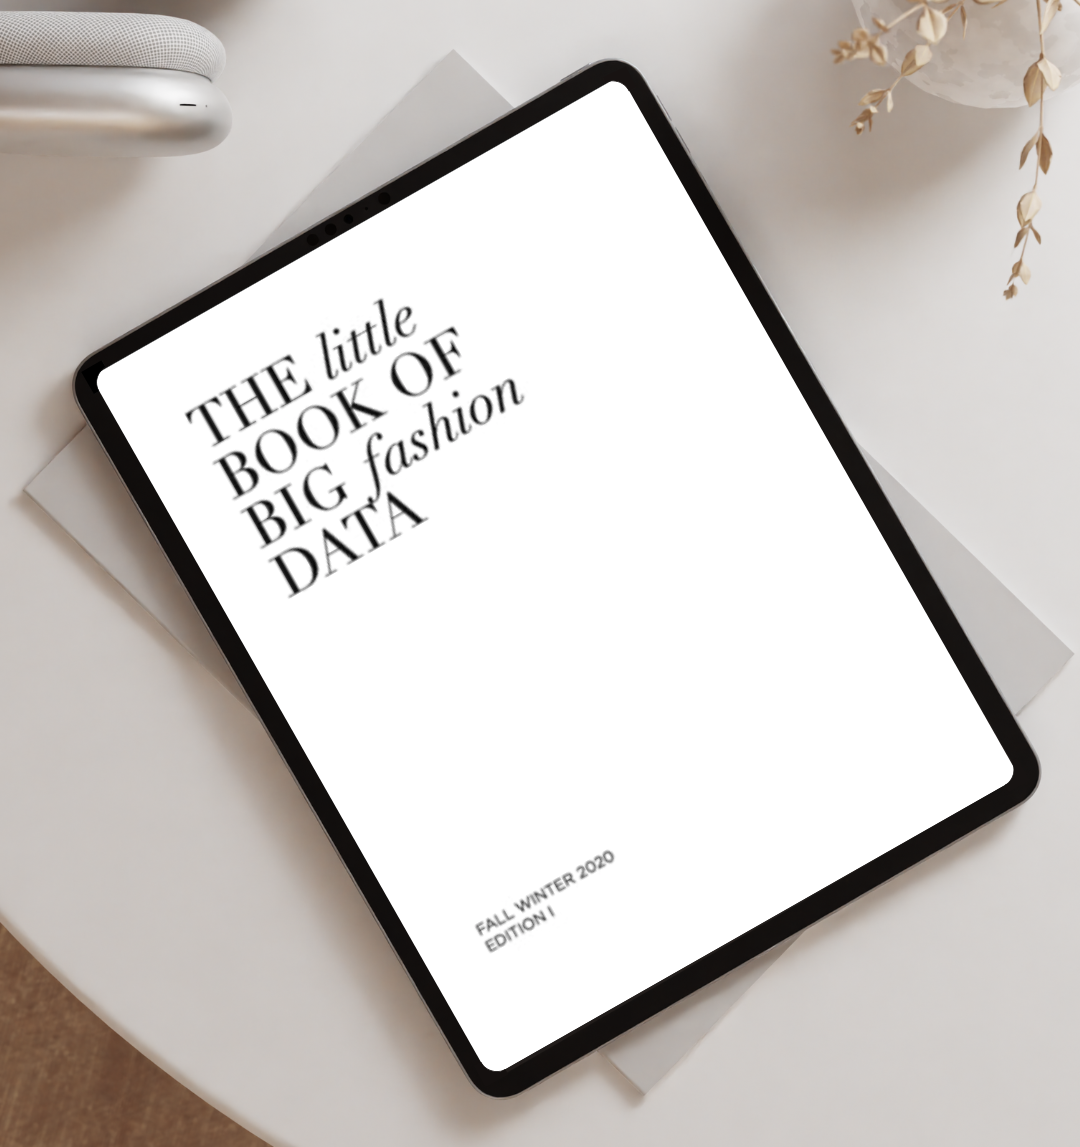
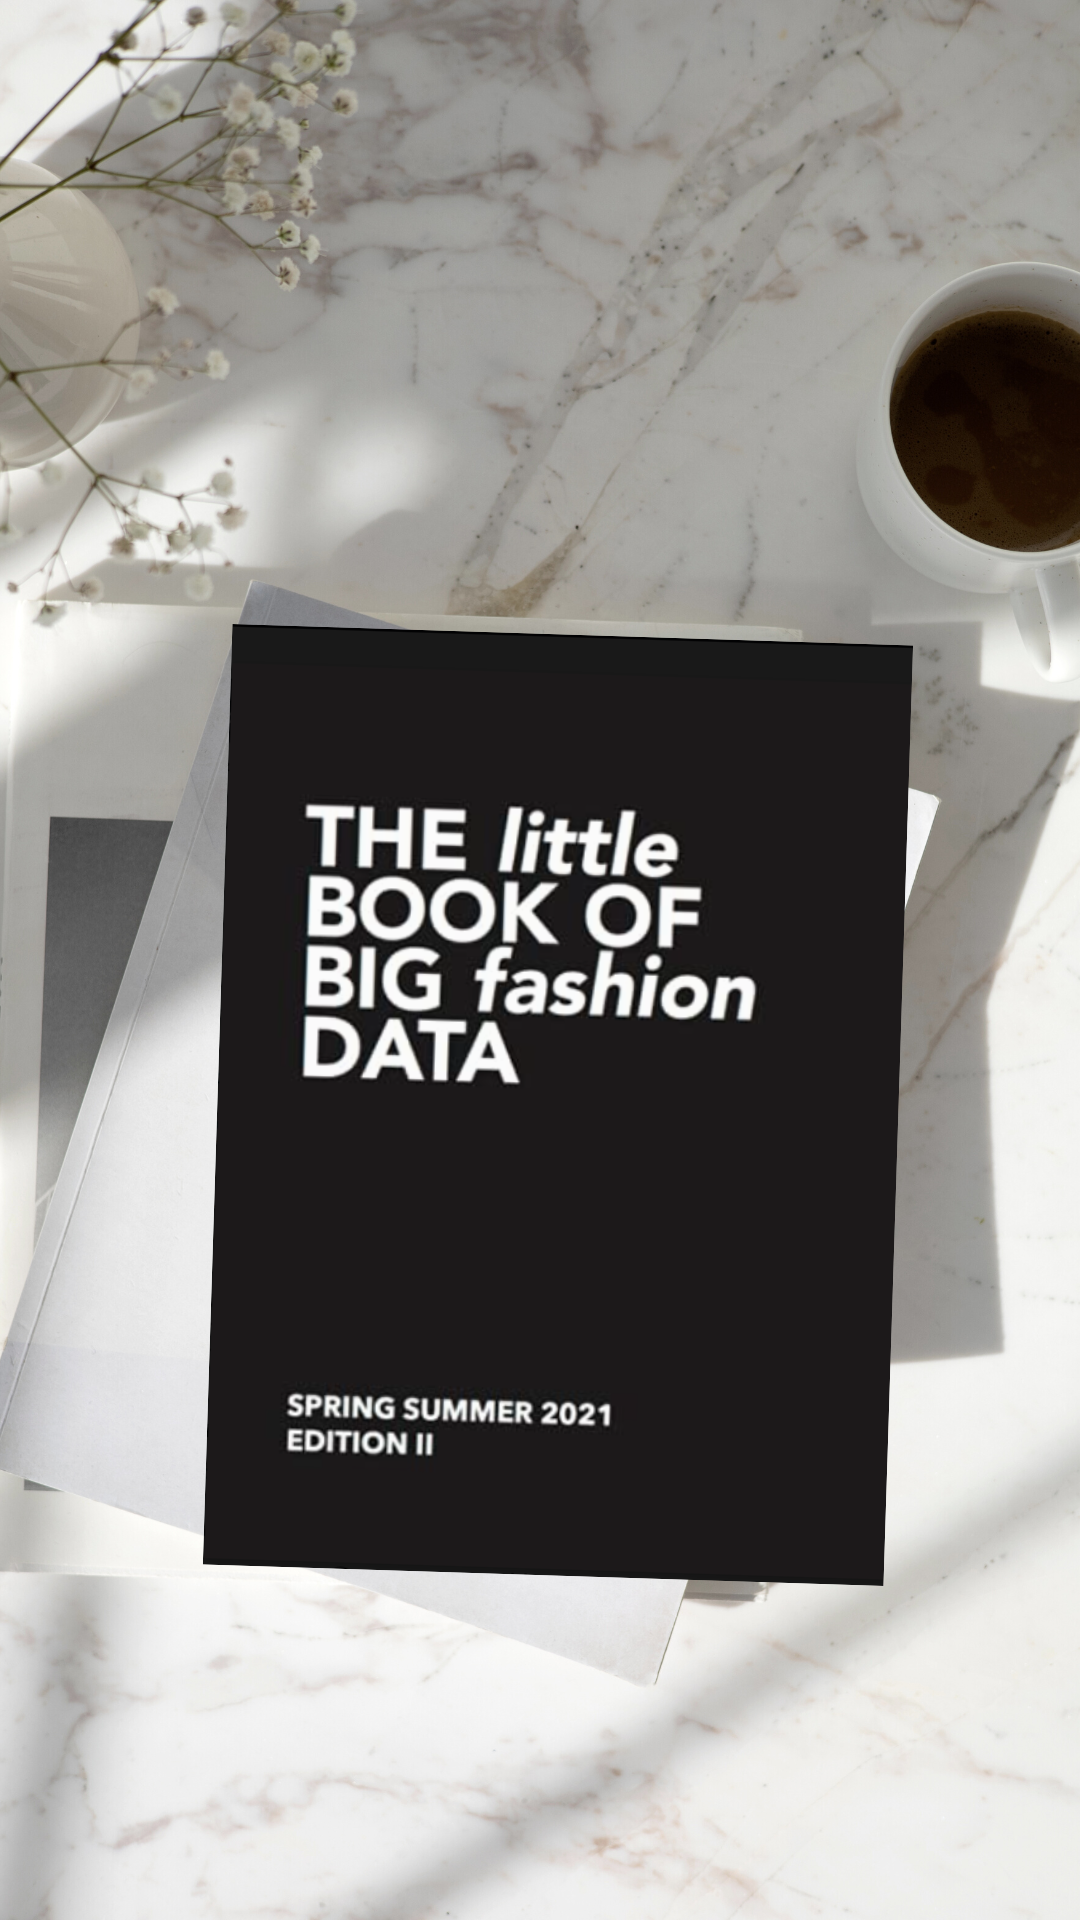
Madé Lapuerta is a Harvard graduate, published author, and developer expanding the definition of what it means to work in software engineering and countering “tech bro” stereotypes. She wrote The Little Book of Big Fashion Data, which compiles the high-fashion trends from runway photos by using data analytics to recognize patterns in images with Python code along with Google Vision AI models. Her work fits in the intersection of fashion, machine learning, and computer vision.
 Let’s take a second to break down those buzzwords.
Data analytics is defined as the systematic analysis of data using computational methods – basically using computers to go through data and draw out insights such as trends, anomalies, and anything we find interesting to know. We tend to think of data as sophisticated statistics stored on our computer and in fancy data servers, but really any information is data: words written on a sheet of paper, your zip code as you type it into an online shopping form, and even cave paintings with every brushstroke. Without data analytics, all that data would stay as pure information, but to gain knowledge from the data, and interpret it so that the information becomes useful to us, we use either our brains, or recently, computers to help us! It’s estimated that in 2020, the amount of digital data that existed in the world was 59 trillion gigabytes.
Computer vision focuses on automating computers to do the job of our eyes and brain; recognizing shapes and colors, and identifying objects. For example, in a black-and-white image made out of pixels, a computer can recognize an edge by comparing the contrast in value of pixels across a range. This might lead to the computer outlining an object as separated from the rest of the background. A computer could use photographs of fashion runway shows to recognize the clothing within the image, and identify the types of clothing the runway model wears or color palette of the outfit, which can be used in conjunction with machine learning to identify trends in hundreds or thousands of images.
Machine learning is a subfield of artificial intelligence that is focused around building models and training algorithms to analyze data so that we don’t have to do it ourselves!. Machine learning makes data analytics faster, more accurate, and more precise. Bringing it back to fashion, some practical applications of machine learning are how retailers use it to plan what clothes to produce for each season, how much to produce, and how to price those clothes to maximize profits.
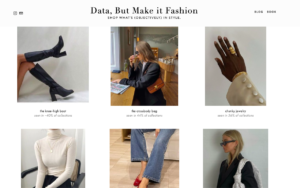
Madé Lapuerta’s website, “Data, But Make It Fashion,” at www.fashionabledata.com gathers her findings in a cleanly designed presentation website. The home page features statistics such as “ballet flats – up 71% in popularity,“ a statement evidenced by her machine learning models, along with a link to an online shop. She writes, “I can go from a folder of hundreds of runway photos to quantifying the outfits’ colors, detecting palettes, and aggregating fashion trend insights” (Lapuerta, 2021). She also writes monthly blog posts about recent trends, surprises within them, and personal anecdotes about her experience in college and as an industry professional.
Madé Lapuerta has quickly become a role model for me as someone in computer science with vastly contrasting interests, including art, fashion, and film. Her advice and encouragement on finding a niche within the broad field of computer science inspire me to stick with it and not be (too) worried about ending up hunched over my laptop from 9-5 every day of my professional life. Maybe I too can be the Little Software Engineer That Could.
References:
- https://theconversation.com/the-worlds-data-explained-how-much-were-producing-and-where-its-all-stored-159964#:~:text=In%202018%2C%20the%20total%20amount,One%20zettabyte%20is%208%2C000%2C000%2C000%2C000%2C000%2C000%2C000%20bits.
- https://www.sas.com/en_us/insights/analytics/machine-learning.html
- https://www.ibm.com/topics/computer-vision