Day: February 11, 2020

  • Do You Live in a Kind Area?

    Do You Live in a Kind Area?

    When I went home to Kansas over Christmas break, we had a particularly nasty snowstorm, and my family and I happened to be out driving while it hit. Our car got stuck while trying to make a turn. This caused traffic to be held up and while in the car, I found myself getting worried, as in Atlanta, when someone holds up traffic, they are usually met with honks and curse words. So, when several people got out of their cars to help push our car out of the snow, to say I was surprised was an understatement. This caused me to wonder if there was a difference in helping behavior between a small town and a big city.

    It turns out there indeed is. A study done in Queensland and New South Wales collected a list of local areas with different population sizes, which were all split into categories of rural area or urban area. They had an investigator stationed in each area who randomly chose every 3rd pedestrian on the street to ask for help on posing as a college student and then recorded the pedestrians’ responses. The results of this study showed that people in rural areas were more willing to stop and help than those in urban areas. There have been many studies done on altruism in urban vs. rural areas and most of their conclusions are similar to that of the study discussed above and show that there is a difference in altruism levels, with levels being higher in rural areas.

    What might cause this difference in helping behavior? There are a few possibilities that may explain it. One is the bystander effect: the more the number of bystanders, the less likely it is for any of them to provide help, as they think there are other people can do it. In big cities, there are more people, whereas in small towns, there are less people, so people in small towns experience less bystander effect. Similarly, it has been shown that people are more willing to help if the situation catches their attention; in big cities, there is constant noise and activity and people’s senses are constantly being overwhelmed, so the chances that they notice a particular individual in need are smaller than in a small town. Finally, another reason may be that people are more willing to help people who are similar to them (e.g. race); in big cities, there is more diversity than in rural areas, which may also impact people’s levels of altruism.

    Ultimately, it seems like there is certainly a difference in helping behavior in urban versus rural areas. This difference does not mean people in urban areas are less helpful or compassionate people, as the reasons for the difference are not intentional and more situational. But it may be good knowledge to know if you are traveling to a new area or if you want to live in an area that has higher levels of altruism.


    References

    Amato, P. R. (1983, January 1). [PDF] Helping behavior in urban and rural environments: Field studies based on a taxonomic organization of helping episodes.: Semantic Scholar. Retrieved February 3, 2020, from https://www.semanticscholar.org/paper/Helping-behavior-in-urban-and-rural-environments:-a-Amato/fdefe7e1b6bec82d5fa99617566dbeb4b410cecf

    Bridges, F. S., & Coady, N. P. (n.d.). Urban Size Differences in Incidence of Altruistic Behavior – F. Stephen Bridges, Neil P. Coady, 1996. Retrieved February 3, 2020, from https://journals.sagepub.com/doi/abs/10.2466/pr0.1996.78.1.307

    Kolm, S.-C., & Ythier, J. M. (2006). Handbook of the Economics of Giving, Altruism and Reciprocity. Retrieved February 3, 2020, from https://books.google.com/books?hl=en&lr=&id=AoT1Lt6uJ7IC&oi=fnd&pg=PR3&dq=reasons+for+altruism&ots=GCTqJC56wb&sig=uaAr1kPDM6yXHPeoec8K0C2JOn8#v=onepage&q=reasons for altruism&f=false
  • Gauging the Tides of Climate Change

    Gauging the Tides of Climate Change

    When scientists or politicians begin to talk about climate change, most people become scared by the severity of the issue at hand, thinking there’s not a lot left for us to do. This fear-mongering tactic typically discourages individual actions like recycling or moving away from meat-focused diets. Scientists surely don’t want to scare the public with the truth, but the fact of the matter is that if we don’t do something now, our generation and all generations to follow will not have a safe or even comfortable planet to live on. This leads us to the question: what exactly can we do to prepare for and mitigate the coming decades of destruction and chaos? 

    The first step to approaching the threat of climate change is to understand the impact we’re facing. To do so, we consider contributing factors in their current capacity that are predicted to change; by observing these patterns early on, it will be easier to assess the risk to infrastructure and communities. Variables that have the capability to become dangerous in the future include global sea level, atmospheric temperatures, ocean acidification, and glacial stability [4, 6]. The severity of predicted impact depends on the response of all of these variables to atmospheric carbon dioxide and other pollutant levels that have already increased global temperature. Scientists anticipate a 68% likelihood of 1-4 feet of sea level rise as a result, with 10 feet being the worst case scenario [1, 4]. With these predictions come the growing probability of worse hurricane seasons due to increased storm surge and extreme precipitation [4]. Even now we see worsening severity of weather events compared to 20 years prior and flooding during high tides in areas below sea level [1].

    GMSL vs time
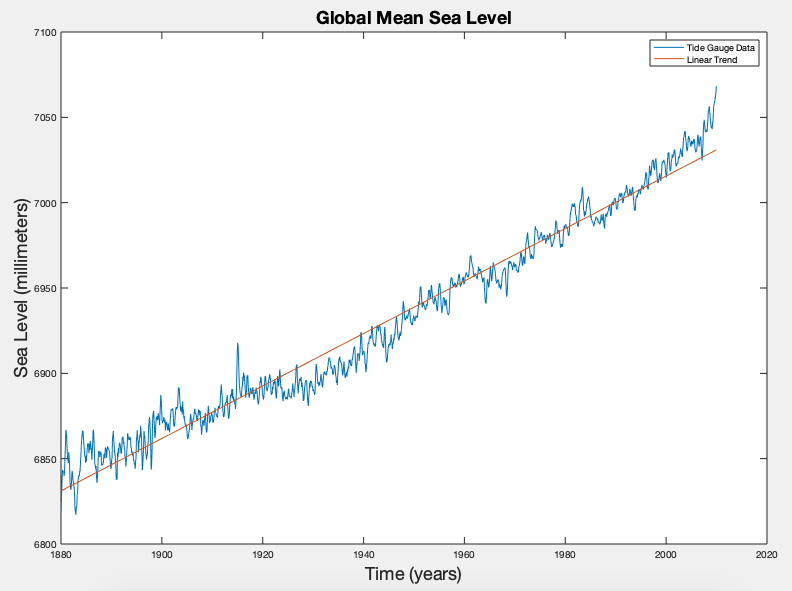
    Global mean sea level since 1880 using tide gauge data from global PSMSL data base.

    Conveniently, scientists have been monitoring sea level globally for nearly 200 years. However, gauging sea level is a bit more difficult than sticking a ruler somewhere on the coast and guessing the relative position over time. In 1807, Thomas Jefferson ordered a systematic survey utilizing “tide staffs”, or long poles that researchers used to compare sea level with a fixed point on nearby land [2]. It wasn’t until 1851 that the US coast guard implemented self recording tide gauges, but the device was still difficult to maintain and expensive to install [2]. Today’s advanced technology records the sea surface height via radar, or microwaves, with respect to the position of the gauge above the water. These gauges are a step up from acoustic gauges that must be protected from inclement weather, and cost upwards of $1300 [1, 2]. Although we have about 200 years of global sea level data, moving onto more reliable and cost efficient methods of measuring current and future sea level change is necessary for any chance of adaptation.


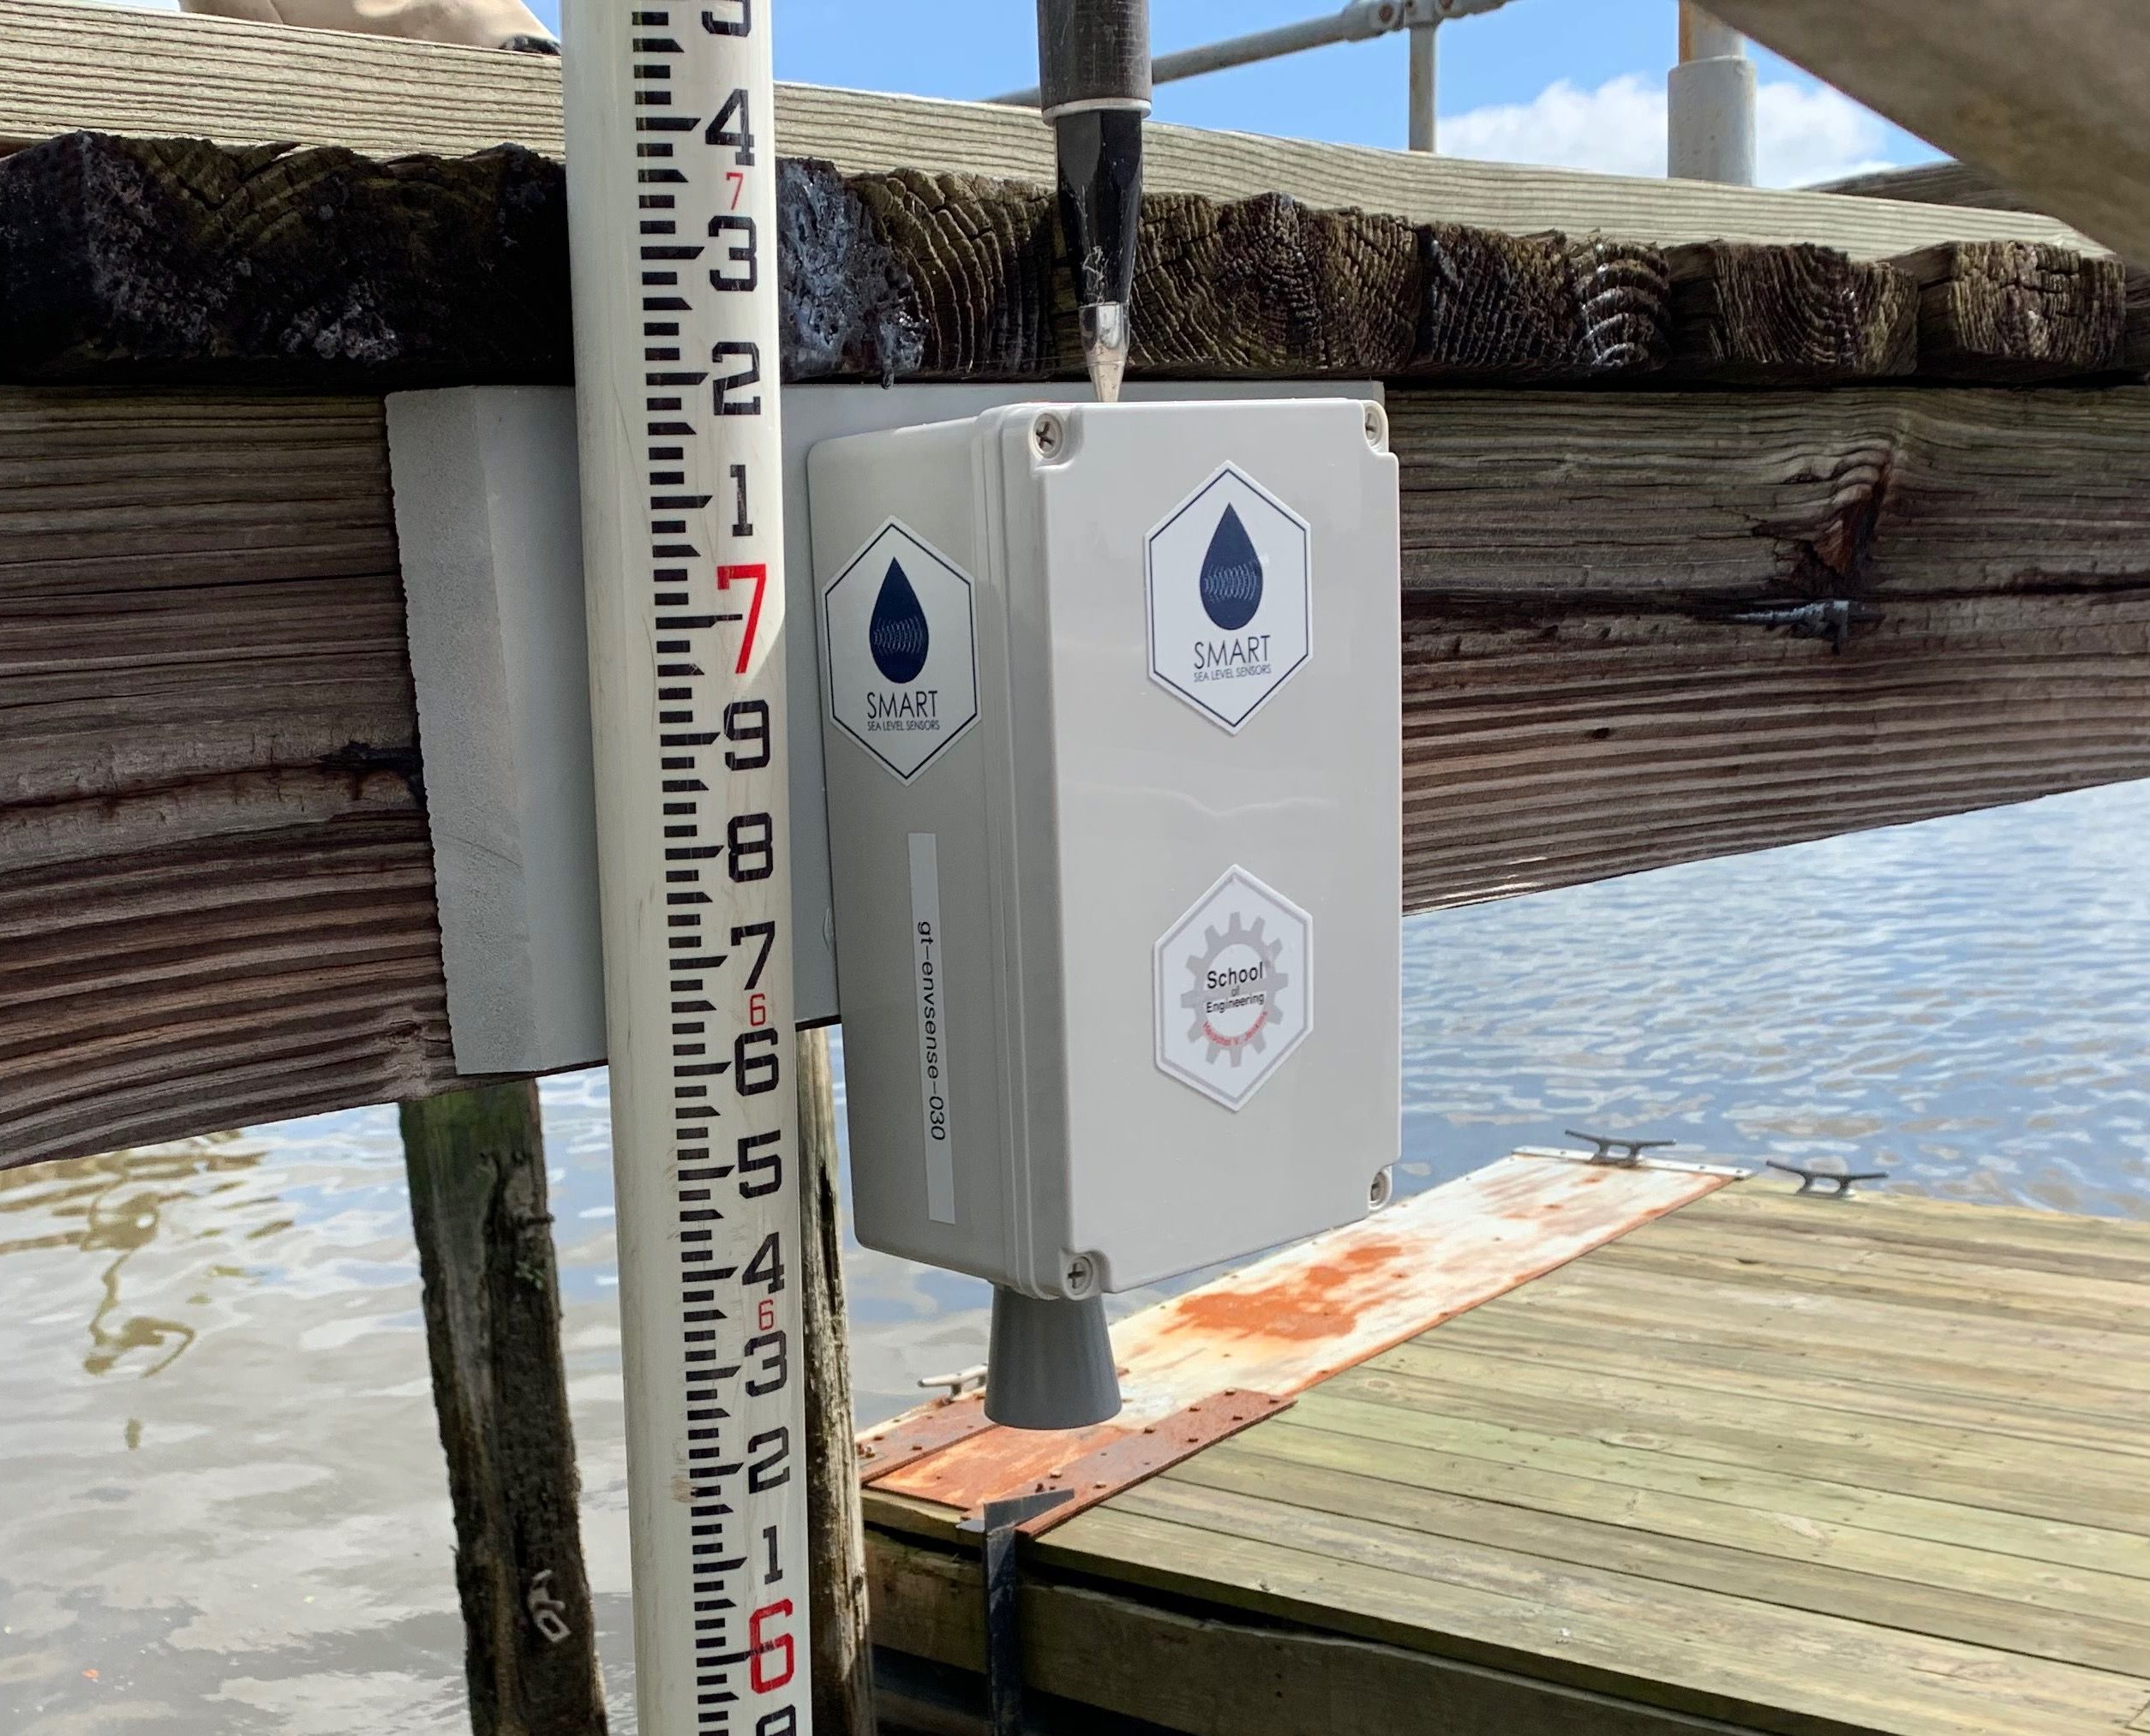
    Dr. Kim Cobb and Dr. Russ Clark of Georgia Tech have spearheaded a project as a key initiative of the Global Change Program to provide low-cost tide gauges for Georgia coastlines. The Smart Sea Level venture is focused on particularly high risk regions, such as Chatham county. These $300 devices currently measure the relative sea level, air temperature, and barometric pressure, with planned capabilities to observe ocean properties, air quality, and inland flooding [5]. The smart sea level sensors use the roundtrip travel time of ultrasonic waves to measure the distance from the sensor to the water level. They log measurements every ten minutes, enabling their batteries to last one year or longer [5]. Already Georgia Tech scientists and collaborators can simulate tides, hurricanes, and extreme weather events via 43 strategically placed sensors [1, 5]. With this data, we’re moving towards predicting the flood patterns linked to severe weather events as atmospheric temperatures and sea levels continue to rise.  

    tide gauge kim cobb
    Smart Sea Level tide gauge adapted from Russ Clark of Georgia Tech.

    As storm surge severity increases, so does the compounded risk of damaging communities beyond repair, which is the true threat of forthcoming extreme weather events. Many low income areas don’t have the resources to assist with evacuation or the infrastructure resilient enough to survive mass flooding. The smart sea level sensor project has led to close collaboration with these communities to provide information on the regions they’re most concerned with: air quality, temperature changes, and the future safety of family neighborhoods and K-12 school grounds [1]. Already the team has joined up with H. V. Jenkins School and Oglethorpe Charter Middle School [7] to recruit volunteers for engineering and installation, and test a climate literacy curriculum, respectively.

    Now the question is to ask, what’s left to do? My personal answer would be to riot and do all we can to support this initiative, but that seems a little drastic. Increasing educational partnerships with high schools and elementary programs would improve awareness amongst the younger generations who are bound to be affected more by climate related concerns. Furthermore, getting into contact with legislators, particularly within the Georgia General Assembly would provide useful in terms of allocating funds towards this cause. With legislators on board, it’s possible legal action could be taken to prevent further damage towards vulnerable communities in areas like Chatham County. Programs such as incentivizing corporate relocation or the mitigation of current industrial hazards, could go a long way in establishing baselines for future climate change strategy. While most legislation to be passed will need to be from within the county, or even at the state level , it wouldn’t hurt to reach national recognition. By promoting climate literacy across the United States, we can increase the number of volunteers assisting with future adaptation, and motivate Congress to aid in the process of protecting these at risk communities [8].  

    If you’re interested in supporting this cause, check out the following volunteer and educational opportunities:

    References:

    1. Cobb, K. (2019, January 24). Smart Sea Level Sensors – Chatham County. Retrieved from http://smartcities.gatech.edu/sites/default/files/GA-Smart-Webinar_Smart-Sea-Level-Sensors_1-24-2019.pdf
    2. Dusto, A. (2014, August 4). Reading between the tides: 200 years of measuring global sea level: NOAA Climate.gov. Retrieved from https://www.climate.gov/news-features/climate-tech/reading-between-tides-200-years-measuring-global-sea-level
    3. Georgia, S. (n.d.). Office of Sustainability. Retrieved from https://www.savannahga.gov/507/Office-of-Sustainability
    4. Lindsey, R. (2019, November 19). Climate Change: Global Sea Level: NOAA Climate.gov. Retrieved from https://www.climate.gov/news-features/understanding-climate/climate-change-global-sea-level
    5. Matthews, R., Cobb, K., & Clark, R. (2019). FAQ. Retrieved from https://www.sealevelsensors.org/faq/
    6. Ocean Acidification. (n.d.). Retrieved from https://www.noaa.gov/education/resource-collections/ocean-coasts-education-resources/ocean-acidification
    7. Jarvis, K. (2019, May 16). Smart Sea Sensors Expo Highlights Accomplishments and Shares Future Plans. Retrieved from https://www.news.gatech.edu/2019/05/16/smart-sea-sensors-expo-highlights-accomplishments-and-shares-future-plans
    8. US Department of Commerce, & National Oceanic and Atmospheric Administration. (2005, December 19). NOS Education Offering. Retrieved from https://oceanservice.noaa.gov/education/literacy.html
  • Engineers Exposed: My Favorite Ethics Scandals

    Engineers Exposed: My Favorite Ethics Scandals

    Imagine training your whole life to become an astronaut. Excelling in aerospace engineering degrees, going through years of training and exams, only for some cold weather to ruin your first mission and cost you your life. Even worse, it could have been prevented.

    Every day we put our lives in the hands of engineers, doctors, and other professionals, trusting that our cars won’t explode, the buildings we walk through won’t fall down, the foods we eat won’t poison us. But, what about when these things do go wrong? Who is to blame? Decide for yourself as I take you through my favorite engineering ethics scandals, they might surprise you!


    The Challenger

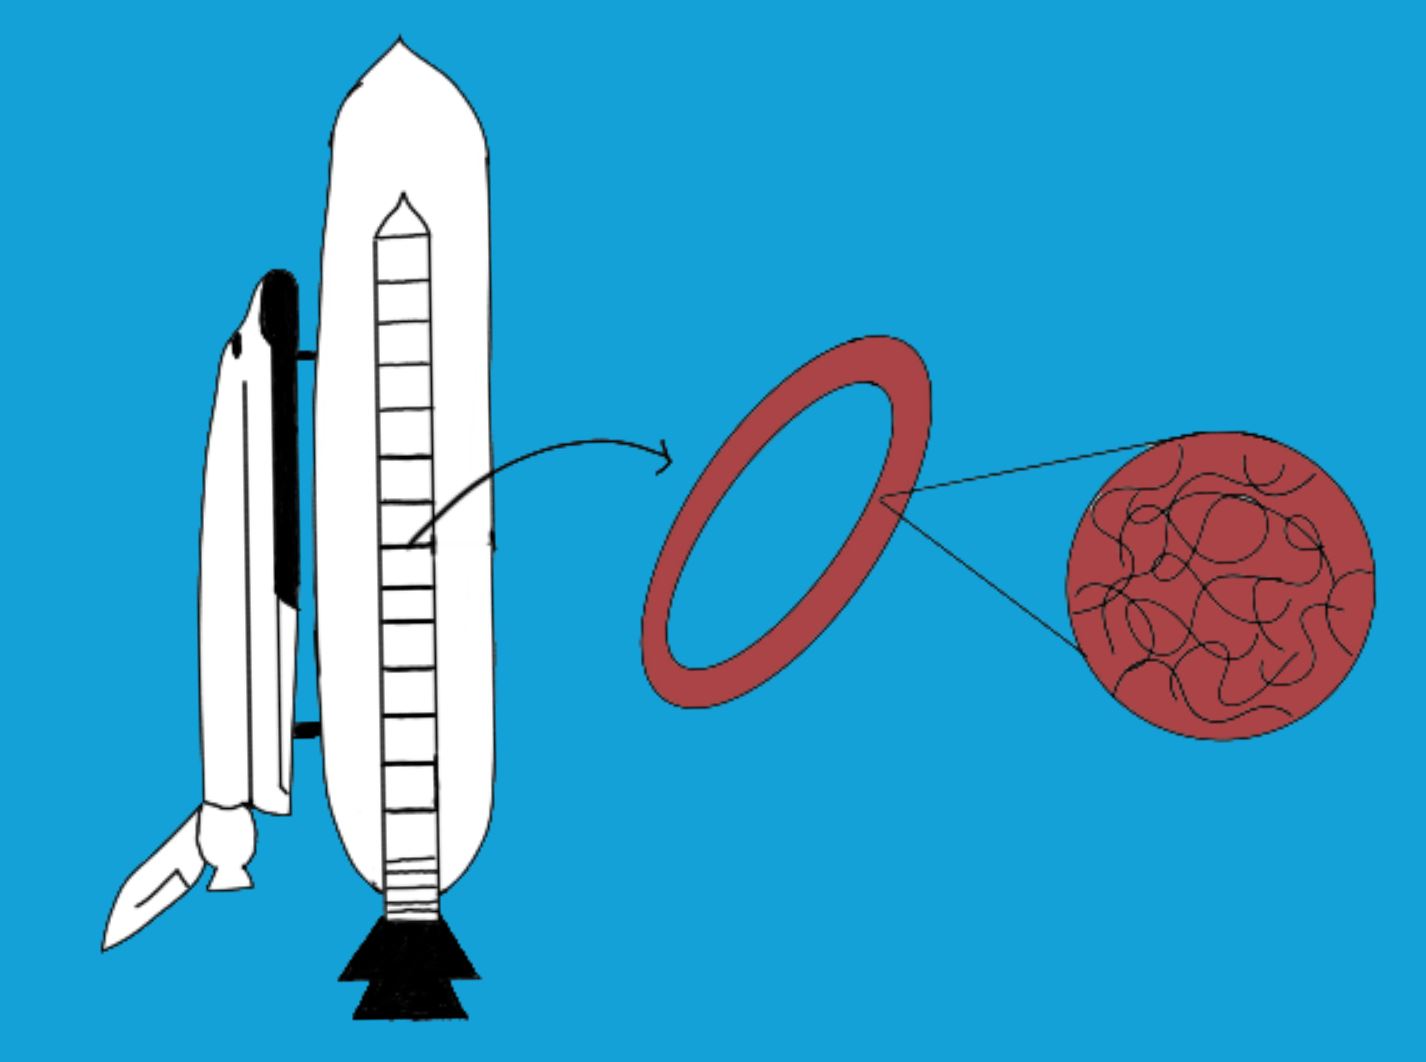
    On January 28th, 1986, the Challenger spaceship exploded, killing all the astronauts on board, including a schoolteacher. What happened? When the ship took off, the rocket booster was supposed to be sealed off by rubber O-rings that would expand to seal when heated up by the gases from the fuel. However, on the day of the launch, the weather was unusually cold, and below the glass transition temperature of the O-rings. This meant that the rubber polymer chains were “frozen” in place, and could not expand quickly enough to seal off the hot gases. This caused the gases to escape and heat up the external fuel tank, resulting in the infamous explosion. Engineers on the project knew it was too cold and presented their data to NASA, but due to poor communication and lack of good data visualization, the launch went on as scheduled .


    The Dalkon Shield

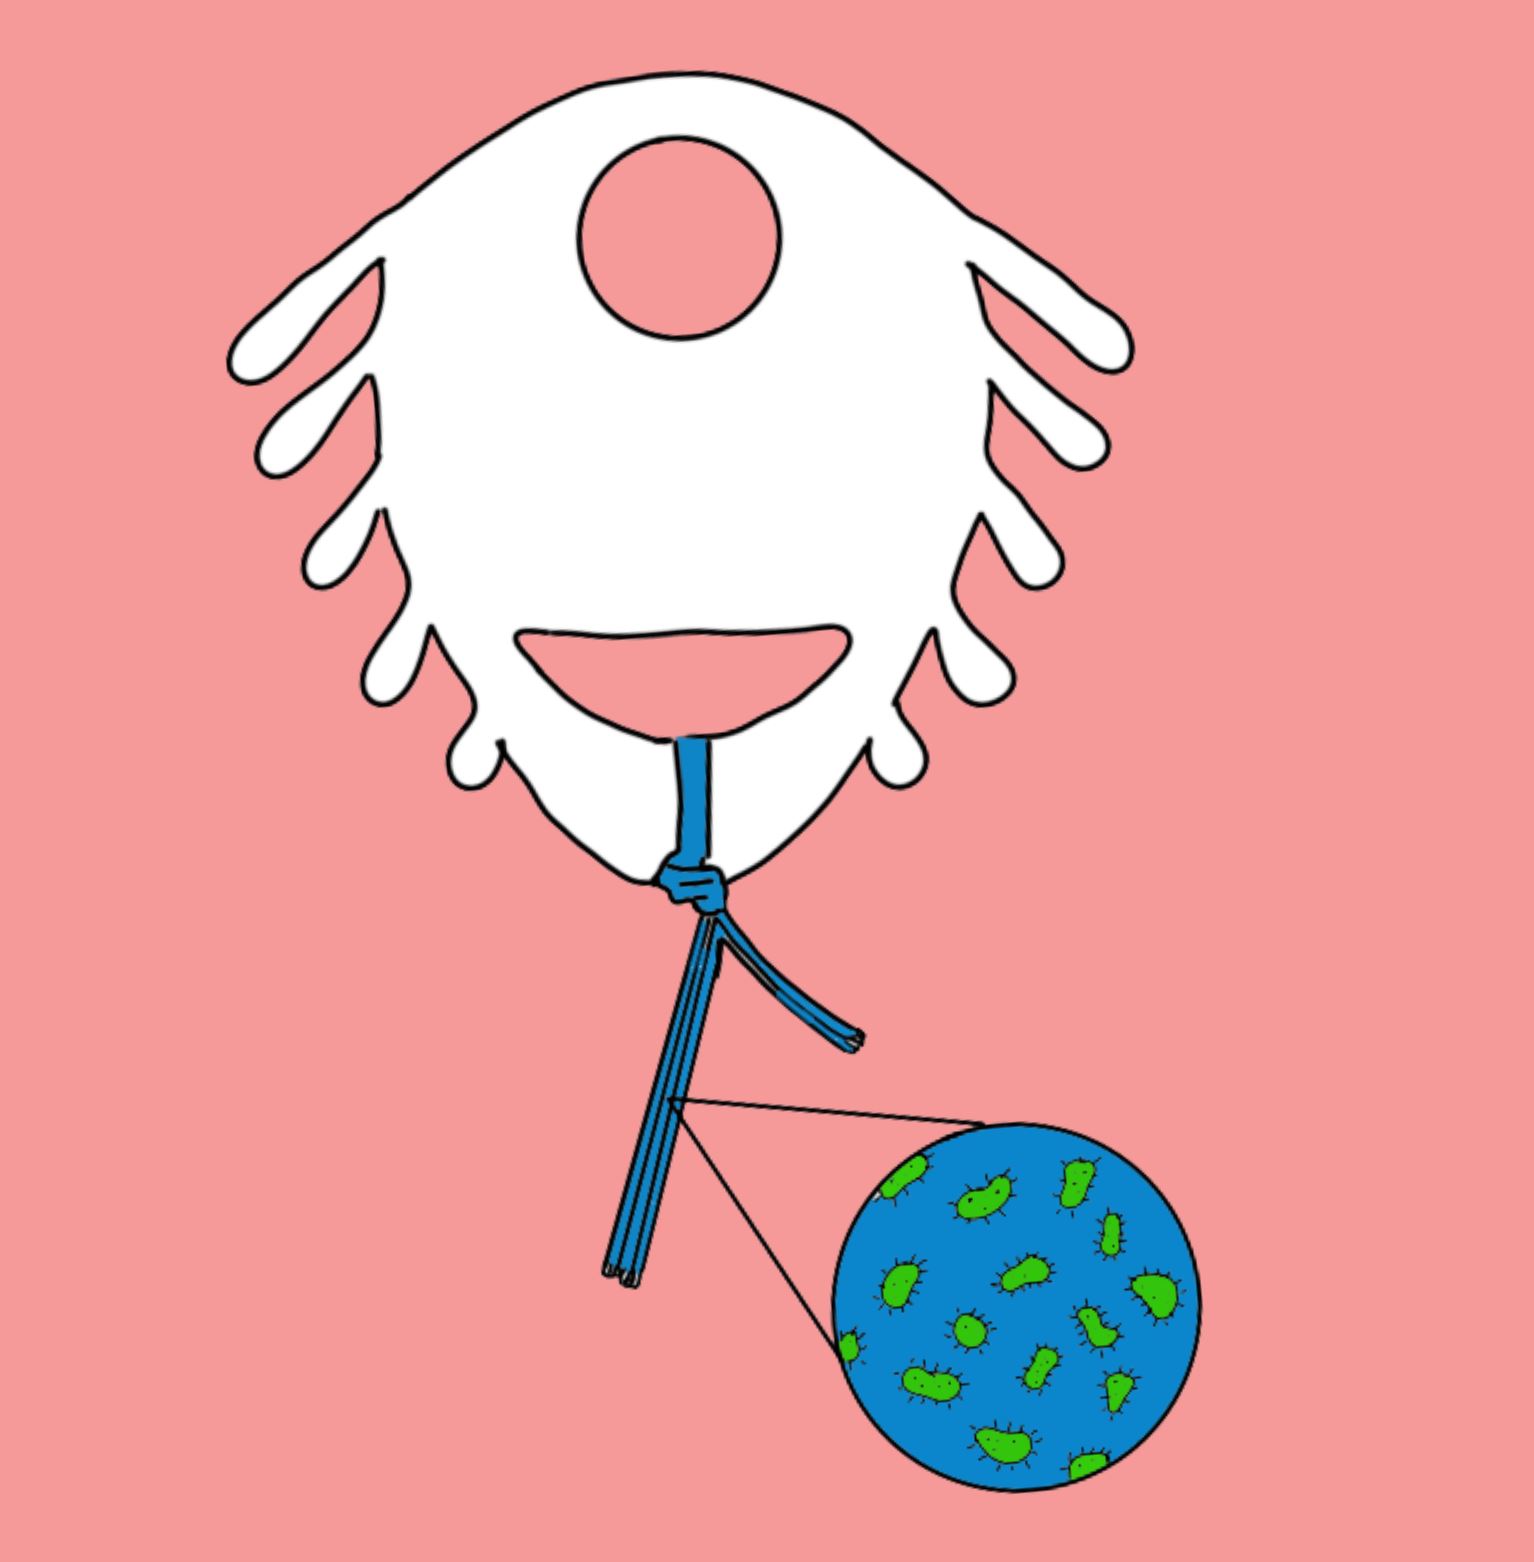
    The Dalkon Shield was an intrauterine device (IUD) sold to women as a birth control alternative in the 1970s and 80s. It was a plastic shield that resembled a crab attached to a string. The plastic shield was embedded with copper, which acts as a natural spermicide. Women were attracted to this non-hormonal device, because there would be no side effects in comparison to the pills that were previously the only available option. It was better than remembering to take a pill at the same time every day. Because it was non-hormonal, it wasn’t considered a drug, so it didn’t need to be FDA approved.

    However, the string attached to the shield was made of a thick filament (cotton/rayon). This would wick up bacteria in the vaginal canal, through the cervix, and into the uterus, causing infections. The company, A.H. Robins, was aware of this problem six months before it was placed on the market.. Pressed to keep costs low, they sold it anyway, with their customers totally unaware. Eventually, the shield resulted in 18 women dead, thousands of women with infections and complications, including infertility.


    The Creep(y) Ceiling Collapse

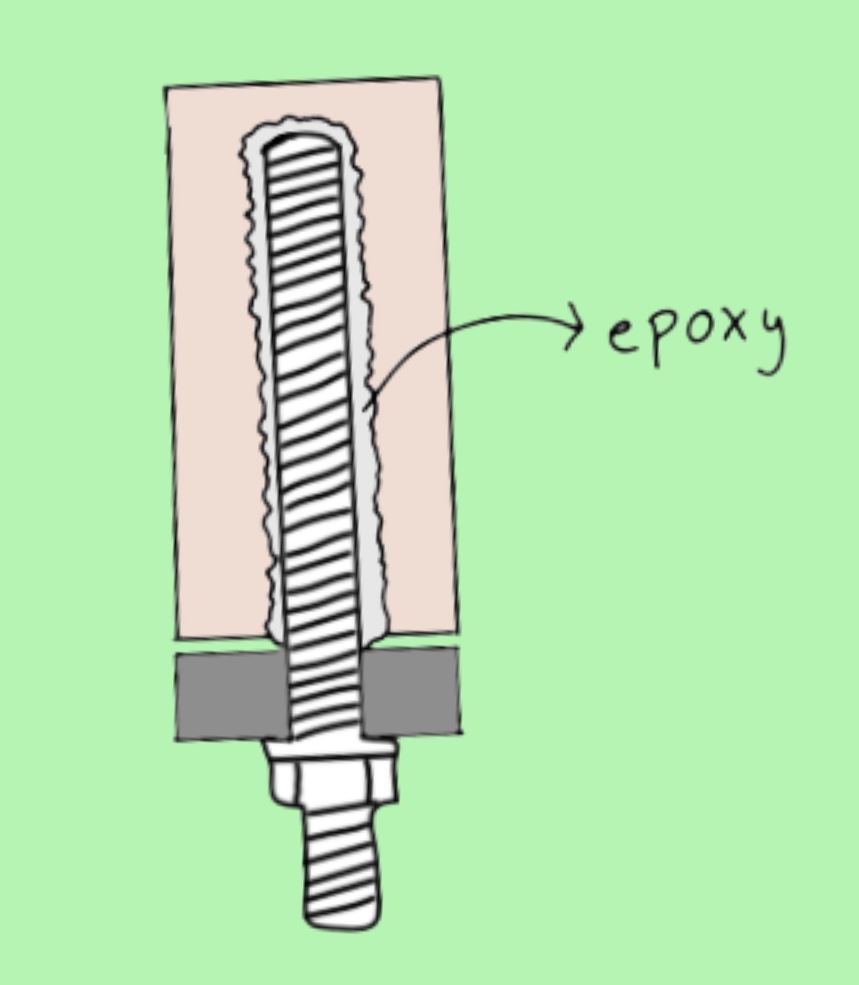
    On July 10th, 2006, concrete ceiling panels in Boston’sTed Williams Tunnel on Interstate 90 suddenly collapsed and killed a woman in her car. The panels were attached to the ceiling with cables to allow air circulation in the tunnel. The problem was that the cables were attached with a material that was susceptible to creep. “Creep” is a term used to describe the phenomenon when a material deforms (or “sags”) after a constant stress is applied over a long time. The accident happened due to miscommunication at multiple levels. The companies responsible for choosing the epoxy, Gannett Fleming, Inc., and Bechtel/Parsons Brinckerhoff, were not well-educated on creep effects, and chose a Fast-Set epoxy supplied by Powers Fasteners, Inc. Powers neglected to inform them of the durability and longevity of the epoxy.  Not only that, but the Massachusetts Turnpike Authority failed to do timely inspections of the ceiling panels and the deteriorating cables holding them up. 


    Do you see the common thread in these cases? I sure do. In each case, important scientific concepts became design flaws that were known by people in the company, but not addressed. Why? It is probably a combination of attitudes of complacency and incompetency in communication skills. It’s also hard for individuals to feel accountable for their actions when there are failures at so many levels of a company, and they too are confused on who to blame

    A cultural shift needs to happen to give engineers and business managers a greater sense of urgency and accountability in their work. This starts from education in ethics and communication. I think universities could be doing much more to train students into becoming better professionals by integrating ethics and communications more heavily into engineering curriculum. Even at Georgia Tech, I’ve seen a lack of education within ethics courses to address topics such as implicit bias and effective communications skills. All of these components impact performance in industry. We can do better. So, why not start now?


    Sources:

    Dalkon Shield:

    1. Horwitz, Rainey, “The Dalkon Shield”. Embryo Project Encyclopedia (2018-01-10). ISSN: 1940-5030 http://embryo.asu.edu/handle/10776/13043.
    2. Dosani, Sanya (Producer). (2020) Sex, Explained.[Video file]. Retrieved from https://www.netflix.com/title/81160763.

    The Challenger:

    1. Wall, Mike. (2016, January 28). Challenger Disaster 30 Years Ago Shocked the World, Changed NASA. Retrieved from https://www.space.com/31760-space-shuttle-challenger-disaster-30-years.html.
    2. Tufte, E.H. (1997) Visual Explanations: Images and Quantities, Evidence and Narrative. Graphics Press.

    Ted Williams Tunnel:

    1. National Transportation Safety Board. (2007) Ceiling Collapse in the Interstate 90 Connector Tunnel Boston, Massachusetts July 10, 2006. (Report ID: NTSB/HAR-07/02 PB2007-916203 Notation 7901A). Retrieved from https://www.ntsb.gov/investigations/AccidentReports/Reports/HAR0702.pdf.